Orientation selectivity and the arrangement of horizontal connections in tree shrew striate cortex - PubMed Skip to main page content
U.S. flag

An official website of the United States government

Dot gov

The .gov means it’s official.
Federal government websites often end in .gov or .mil. Before sharing sensitive information, make sure you’re on a federal government site.

Https

The site is secure.
The https:// ensures that you are connecting to the official website and that any information you provide is encrypted and transmitted securely.

Access keys NCBI Homepage MyNCBI Homepage Main Content Main Navigation
. 1997 Mar 15;17(6):2112-27.
doi: 10.1523/JNEUROSCI.17-06-02112.1997.

Orientation selectivity and the arrangement of horizontal connections in tree shrew striate cortex

Affiliations

Orientation selectivity and the arrangement of horizontal connections in tree shrew striate cortex

W H Bosking et al. J Neurosci. .

Abstract

Horizontal connections, formed primarily by the axon collaterals of pyramidal neurons in layer 2/3 of visual cortex, extend for millimeters parallel to the cortical surface and form patchy terminations. Previous studies have provided evidence that the patches formed by horizontal connections exhibit modular specificity, preferentially linking columns of neurons with similar response characteristics, such as preferred orientation. The issue of how these connections are distributed with respect to the topographic map of visual space, however, has not been resolved. Here we combine optical imaging of intrinsic signals with small extracellular injections of biocytin to assess quantitatively the specificity of horizontal connections with respect to both the map of orientation preference and the map of visual space in tree shrew V1. Our results indicate that horizontal connections outside a radius of 500 microm from the injection site exhibit not only modular specificity, but also specificity for axis of projection. Labeled axons extend for longer distances, and give off more terminal boutons, along an axis in the map of visual space that corresponds to the preferred orientation of the injection site. Inside of 500 microm, the pattern of connections is much less specific, with boutons found along every axis, contacting sites with a wide range of preferred orientations. The system of long-range horizontal connections can be summarized as preferentially linking neurons with co-oriented, co-axially aligned receptive fields. These observations suggest specific ways that horizontal circuits contribute to the response properties of layer 2/3 neurons and to mechanisms of visual perception.


Figures
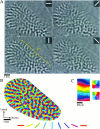
Fig. 1.
Fig. 1.
Optical imaging of intrinsic signals in tree shrew visual cortex. A, Difference images obtained for four stimulus angles (0°, 45°, 90°, 135°, shown ininset of each panel) from one animal. Black areasof each panel indicate areas of cortex that were preferentially activated by a given stimulus, and light gray areasindicate areas that were active during presentation of the orthogonal angle. The dashed line in the 90° panel indicates the approximate location of the V1/V2 border. B, Orientation preference map obtained by vector summation of data obtained for each angle. Orientation preference of each location is color-coded according to the key shown below. C, Common features of the orientation preference maps. Portions of the orientation preference map shown in B have been enlarged to demonstrate that the orientation preference maps contained both linear zones (left) and pinwheel arrangements (right).
Fig. 2.
Fig. 2.
Biocytin injections made into superficial layers of V1. A, Low-power image showing an injection site, labeled axons leaving the site, and several patches formed by axon arbors. Radial vessel profiles used in aligning tissue sections are also visible. Scale bar, 100 μm. B, The same injection site seen in A shown at higher power. Individual cells that have taken up the biocytin can be identified. Scale bar, 25 μm.C, A patch of biocytin label shown at higher magnification. Labeled boutons are visible on the axons. Scale bar, 25 μm.
Fig. 3.
Fig. 3.
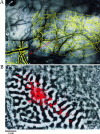
Alignment of bouton distributions to optical imaging data (case 9509). A, The image in thebackground is a reference image taken during the optical imaging phase of the experiment. The yellow overlay is a computer-assisted drawing of blood vessel outlines and radial vessel profiles seen in the first tissue section. The drawing has been scaled, rotated, and translated to align with the reference image. Theblue overlay is a computer-assisted drawing of radial vessel profiles and the section outline from a deeper section that contained labeled boutons. This section has been independently scaled, rotated, and translated to align with the reference image and the first tissue section. The precision of both stages of the alignment can be seen in the inset. B, Same animal and field of view as seen in A. The reference image has been replaced with a difference image showing areas active for a 90° stimulus in black. Bouton distribution information has been added using the same transforms used to align the blue section in A. The green symbols indicate cells that took up and transported the biocytin. Red symbolsindicate locations of labeled boutons. Scale bar, 400 μm forinset in A.
Fig. 4.
Fig. 4.
Bouton distributions shown over orientation preference maps for two cases. A, Bouton distribution after an injection into a site with a preferred orientation of 80°, determined by recording through the same tip used to make the injection (same case as in Fig. 3). The white symbols indicate the location of cells that took up the biocytin. Labeled boutons (black symbols) are found at sites with all orientation preferences near the injection site, but preferentially at sites with the same orientation preference as the injection site at longer distances. B, Results from an experiment in which an injection was made into a site with an orientation preference of 160° (case 9517). Color key and scale bar apply to both figures.
Fig. 5.
Fig. 5.
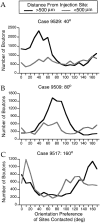
Quantitative analysis of modular specificity of bouton distributions. The number of boutons that overlie a particular 10° range of orientation preference is shown separately for boutons that are found <500 μm from the injection site (gray curves) and those found at >500 μm distance (black curves). In each case, for the boutons found at >500 μm, a peak is seen at or near the preferred orientation of the injection site.
Fig. 6.
Fig. 6.
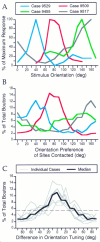
Correspondence between orientation tuning of injection sites and specificity of bouton distributions for four cases.A, Orientation tuning curves determined from recordings of multiunit activity that were made through the biocytin-filled pipettes at each injection site. Normalized responses are plotted versus stimulus orientation. B, Bouton tuning curves for the same cases shown in A, plotted in the same color asA. For each case, the percentage of the total number of boutons that overlie sites with a given orientation preference is plotted. Only boutons found at distances >500 μm from the injection site were used in this analysis. Each curve has a peak at or near the peak of the physiologically determined tuning curve shown inA. C, Data from all seven of our combined imaging and biocytin injection experiments. The bouton tuning curves for each case are expressed as the percentage of the boutons that contact sites that differ in orientation preference from the injection site by a specified amount. Individual cases are shown ingray, and the median is shown in black. The dashed line shown at 5.56% reflects the percentage of boutons expected in each of the 18 bins if the boutons were distributed evenly over the map of orientation preference.
Fig. 7.
Fig. 7.
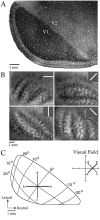
The map of visual space in tree shrew V1.A, Photomicrograph of a Nissl-stained section of visual cortex. V1 stands out clearly as the darkly stainedregion of the section. B, Topographic difference images for four stimulus angles. The dark bands andlight bands ∼0.5–1.0 mm wide in each image reflect areas of cortex that were differentially activated by the two grating patterns for that stimulus angle (see Materials and Methods for details). The distance between a pair of dark or light bands corresponds to 10° in the map of visual space. The 0° and 90° images represent iso-elevation and iso-azimuth lines. C, Diagram of the right visual field and left visual cortex of the tree shrew, modified from a figure by Kaas (1980). Lines at 45° orientation (black line) and at 135° orientation (gray line) are shown as they would appear in the visual field and in the cortex.
Fig. 8.
Fig. 8.
Bouton distributions from four cases. The preferred orientation for each case is shown in the top right of each panel. The axis in cortex corresponding to the preferred orientation is indicated by the gray rectangleunderlying each distribution. Each point indicates an individual bouton. Note the dense distribution of boutons found near the injection site and more patchy distribution found at longer distances. In each case, the distribution is elongated along an axis that corresponds to the preferred orientation of the injection site.
Fig. 9.
Fig. 9.
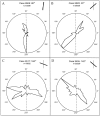
Quantification of bouton distributions for four cases. For each case, the number of boutons found in successive 10° sectors around the injection is quantified. Distance from the origin indicates the number of boutons found in a given sector normalized to the maximum number of boutons found in any sector for that case. The 0° sector was assigned by drawing a line through the injection site that was orthogonal to the V1/V2 border, and the remaining sectors were assigned in clockwise manner. Only boutons outside of 500 μm were used in this analysis. The preferred orientation of the injection site for each case is indicated by the black bar in eachinset. The thin gray line in the visual field diagrams and the gray dashed lines in the polar plots correspond to the vertical meridian.
Fig. 10.
Fig. 10.
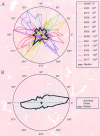
Correspondence between preferred orientation of injection sites and the axial specificity of the bouton distributions.A, Polar plots are shown for all 13 cases examined for axial specificity. Each polar plot was constructed as described in Figure 9 and is color-coded according to the orientation preference of the injection site for that case. The black curve is the median of the 13 cases. B, Data from all 13 cases were combined by rotating each curve by a number of degrees equal to the orientation preference at the injection site for that case. Gray lines indicate individual cases, and the black lineindicates the normalized median of all 13 cases.
Fig. 11.
Fig. 11.
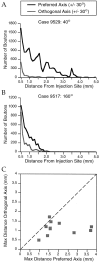
Quantification of elongation of bouton distributions. A, Number of boutons versus distance in 100 μm bins along both the preferred (black curve) and orthogonal (gray curve) axes (±30°). Preferred orientation for this case was 40°. B, Same information shown for a case that had a preferred orientation of 160°.C, Scatterplot showing the maximum distance at which boutons were found to exceed a minimum density of 40 boutons/0.01 mm2 along the preferred and orthogonal axes (±30°) for 10 cases. Dashed lines indicate equal distance along preferred and orthogonal axes.
Fig. 12.
Fig. 12.
Summary of specificity of horizontal connections in V1. A, Example of axon arborizations from two cells shown over a combined map of visual space and difference map of orientation preference. The dark regions of the difference map indicate regions that prefer 90°, and thelighter areas indicate areas that prefer 0°. A neuron found in a dark region of the map projects to other areas of the map with the same orientation preference and that lie along a line corresponding to a vertical line in the map of visual space. A neuron found in a light region of the map (orientation preference 0°) projects to other parts of the cortex that prefer 0° and that lie along a horizontal line in the map of visual space. B, Input to layer 2/3 cells via horizontal connections. Because horizontal connections are largely reciprocal, cells in layer 2/3 will receive input from other layer 2/3 cells with the same orientation preference, the receptive fields of which are displaced along a line in visual space. The solid rectangles indicate the receptive fields of the two cells shown in A. The open rectangles indicate the receptive fields of cells that would provide input to these two cells via horizontal connections. Nearby cells with overlapping receptive fields are omitted for clarity.

Similar articles

Cited by

References

    1. Albus K, Wahle P. The topography of tangential inhibitory connections in the postnatally developing and mature striate cortex of the cat. Eur J Neurosci. 1994;6:779–792. - PubMed
    1. Albus K, Wahle P, Lubke J, Matute C. The contribution of GABA-ergic neurons to horizontal intrinsic connections in upper layers of the cat’s striate cortex. Exp Brain Res. 1991;85:235–239. - PubMed
    1. Amir Y, Harel M, Malach R. Cortical hierarchy reflected in the organization of intrinsic connections in macaque monkey visual cortex. J Comp Neurol. 1993;334:19–46. - PubMed
    1. Blasdel GG. Orientation selectivity, preference, and continuity in monkey striate cortex. J Neurosci. 1992;12:3139–3161. - PMC - PubMed
    1. Blasdel GG, Yoshioka T, Levitt JB, Lund JS. Correlation between patterns of lateral connectivity and patterns of orientation preference in monkey striate cortex. Soc Neurosci Abstr. 1992;18:389.

Publication types

MeSH terms

LinkOut - more resources