Unified classification of mouse retinal ganglion cells using function, morphology, and gene expression - PubMed Skip to main page content
U.S. flag

An official website of the United States government

Dot gov

The .gov means it’s official.
Federal government websites often end in .gov or .mil. Before sharing sensitive information, make sure you’re on a federal government site.

Https

The site is secure.
The https:// ensures that you are connecting to the official website and that any information you provide is encrypted and transmitted securely.

Access keys NCBI Homepage MyNCBI Homepage Main Content Main Navigation
. 2022 Jul 12;40(2):111040.
doi: 10.1016/j.celrep.2022.111040.

Unified classification of mouse retinal ganglion cells using function, morphology, and gene expression

Affiliations

Unified classification of mouse retinal ganglion cells using function, morphology, and gene expression

Jillian Goetz et al. Cell Rep. .

Abstract

Classification and characterization of neuronal types are critical for understanding their function and dysfunction. Neuronal classification schemes typically rely on measurements of electrophysiological, morphological, and molecular features, but aligning such datasets has been challenging. Here, we present a unified classification of mouse retinal ganglion cells (RGCs), the sole retinal output neurons. We use visually evoked responses to classify 1,859 mouse RGCs into 42 types. We also obtain morphological or transcriptomic data from subsets and use these measurements to align the functional classification to publicly available morphological and transcriptomic datasets. We create an online database that allows users to browse or download the data and to classify RGCs from their light responses using a machine learning algorithm. This work provides a resource for studies of RGCs, their upstream circuits in the retina, and their projections in the brain, and establishes a framework for future efforts in neuronal classification and open data distribution.

Keywords: CP: Neuroscience; retina, retinal ganglion cell, transcriptomics, morphology, light responses, classification.


Conflict of interest statement

Declaration of interests The authors declare no competing interests.

Figures
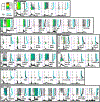
Figure 1.
Figure 1.. Functional diversity of mouse RGCs
Each panel (separated by purple lines) contains three graphs showing the light response of an RGC type to flashed spots of light (200 R*/rod/s) from darkness. The top left graph (marked “c” in ON alpha panel) is a heatmap of average firing rate over time (x axis) for spots from 30–1,200 µm (y axis). Dashed lines show the time of spot onset and offset. The top right graph (marked “b” in the ON alpha panel) shows the total spike count during flash onset (cyan) and offset (black) for each spot size. The solid lines indicate mean across cells and the shaded regions indicate standard deviation (SD). The bottom graph (marked “a” in the ON alpha panel) shows peristimulus time histogram plots averaging the response of each cell type to 200 µm spots, indicated in upper plots by red dotted lines. Scale bars in the upper left region are shared across all graphs. Separate scale bars for the y axis of the PSTH plots are provided within each boxed group of cells and apply within that box. Abbreviations for cell types: sus, sustained; tr, transient; med, medium; EW, Eyewire (named based on the Eyewire museum); OS, orientation-selective; h, horizontal; v, vertical; DS, direction-selective; SmRF, small receptive field; MeRF, medium receptive field; LgRF, large receptive field; HD, high definition; UHD, ultrahigh definition; LED, local edge detector; (b,s)SbC, (bursty, sustained) suppressed-by-contrast.
Figure 2.
Figure 2.. Visualization of functional relationships among RGCs
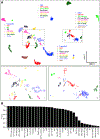
(A) UMAP projection of 1,859 RGCs labeled by assigned functional type. Insets show magnified views of boxed regions. (B) F score for each RGC type, the harmonic mean of the precision (fraction of a given cluster representing a single-labeled type) and recall (fraction of our labeled cells of a given type in a single cluster) of its identification within a single DBSCAN cluster.
Figure 3.
Figure 3.. Functional classification from spot responses
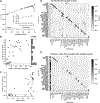
(A) Overall model accuracy (y axis) as a function of the fraction of unclassified cells in the test cells (x axis), which increases with the classification margin. The dashed line represents the expected accuracy of a random classifier. Inset: fraction of instances when the correct choice was present among the top 1–10 probability scores in the classifier output. (B) Fraction of test cells of each type classified correctly versus the number of cells of that type in the training set. Histogram at the right shows the distribution of classifier accuracy across RGC types. (C) Accuracy of classification for each RGC type versus its F score from (B). (D) Confusion matrix (row normalized) for the classifier with no explicit classification margin set. Dotted lines separate RGC groups as in Figure 2. (E) Confusion matrix (row normalized) for the classifier with a classification margin of 0.205. The fraction of unclassified cells of each type is shown in the first column. Remaining entries in the matrix only consider classified cells.
Figure 4.
Figure 4.. Morphological diversity of mouse RGCs
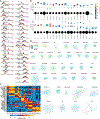
(A) Stratification profile of each RGC type along the depth of the IPL from its outer (left) to inner (right) limits. Dashed lines indicate ChAT bands. Profiles include individual cells (thin gray lines), the mean (thick black line), and SD (gray shading), as well as the presumed matching type(s) in the Eyewire museum (shades of red). (B) Summary plot of the morphology of each RGC type. Colored rectangles depict the mean and full-width-at-half-maximum of each dendritic stratum within the IPL (vertical scale) and the equivalent diameter (according to its diameter) of the stratum in the plane of the IPL (horizontal scale). Stata are colored by arbor density. Somas are drawn as circles relative to their diameter on a separate horizontal scale, as indicated. (C) Mean overlap between the stratification profile of each measured cell and each template from the Eyewire museum as cosine similarity. (D) Gallery of en face skeleton example images of each RGC type colored by IPL depth. Full galleries of all skeleton images and those in the Eyewire museum can be found at rgctypes.org..
Figure 5.
Figure 5.. Matches between functional types and transcriptomic clusters
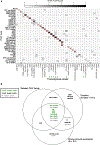
(A) Heatmap showing correspondence between functional types (rows) and transcriptomic clusters reported in Tran et al. (2019) (columns). Matches used in subsequent analyses are indicated by an “X.” Color scale indicates the number of patch sequencing cells matched to each cluster. See STAR Methods for matching procedure. Green arrowheads indicate T5 RGCs as described in Tran et al. (2019). (B) Venn diagram of RGC types, including one morphological characteristic (stratification between the ChAT bands) and two functional characteristics (transience and surround suppression). Green text denotes cell types matched to transcriptomic clusters identified as T5 RGCs, characterized by the specific expression of gene Tusc5/Trarg1 in Tran et al. (2019).
Figure 6.
Figure 6.. Correspondence between RGC relatedness in functional, morphological, and transcriptomic space
(A) UMAP embedding of RGC morphology constructed from the stratification profiles in the Eyewire museum (Bae et al., 2018). Inset shows boxed region at higher magnification. (B) UMAP embedding of RGC gene expression from Tran et al. (2019). Cluster labels removed for clarity. (C) Alignments between the three classification schemes that we used for subsequent analysis. Lines connect putative corresponding RGC types in each classification schema. (D) List of RGC types ranked by the z-normalized fractional overlap between functional and stratification embeddings. Shaded region indicates 1 SD around the expectation from the null distribution. Top: local neighborhood (2–4) neighbors. Bottom: global neighborhood (5–12 neighbors). (E and F) Same as (D) but showing alignment between functional and morphological space (E) or morphological and gene expression space (F). Local neighborhood for (E and F) is 2–3 neighbors and global neighborhood is 4–8 neighbors.
Figure 7.
Figure 7.. Screenshots from rgctypes.org.
(A) Landing page for the HD1 RGC. (B) Table of RGC types. (C) Data download area. (D) Expanded, interactive graph of HD1 RGC light responses.

Similar articles

Cited by

References

    1. Arshadi C, Günther U, Eddison M, Harrington KIS, and Ferreira TA (2021). SNT: a unifying toolbox for quantification of neuronal anatomy. Nat. Methods 18, 374–377. 10.1038/s41592-021-01105-7. - DOI - PubMed
    1. Awatramani GB, and Slaughter MM (2000). Origin of transient and sustained responses in ganglion cells of the retina. J. Neurosci 20, 7087–7095. 10.1523/jneurosci.20-18-07087.2000. - DOI - PMC - PubMed
    1. Baden T, Berens P, Franke K, Román Rosón M, Bethge M, and Euler T (2016). The functional diversity of retinal ganglion cells in the mouse. Nature 529, 345–350. 10.1038/nature16468. - DOI - PMC - PubMed
    1. Bae JA, Mu S, Kim JS, Turner NL, Tartavull I, Kemnitz N, Jordan CS, Norton AD, Silversmith WM, Prentki R, et al. (2018). Digital museum of retinal ganglion cells with dense anatomy and physiology. Cell 173, 1293–1306.e19. 10.1016/j.cell.2018.04.040. - DOI - PMC - PubMed
    1. Becht E, McInnes L, Healy J, Dutertre C-A, Kwok IWH, Ng LG, Ginhoux F, and Newell EW (2018). Dimensionality reduction for visualizing single-cell data using UMAP. Nat. Biotechnol 10.1038/nbt.4314. - DOI - PubMed

Publication types