Predicting and Manipulating Cone Responses to Naturalistic Inputs - PubMed Skip to main page content
U.S. flag

An official website of the United States government

Dot gov

The .gov means it’s official.
Federal government websites often end in .gov or .mil. Before sharing sensitive information, make sure you’re on a federal government site.

Https

The site is secure.
The https:// ensures that you are connecting to the official website and that any information you provide is encrypted and transmitted securely.

Access keys NCBI Homepage MyNCBI Homepage Main Content Main Navigation
. 2022 Feb 16;42(7):1254-1274.
doi: 10.1523/JNEUROSCI.0793-21.2021. Epub 2021 Dec 23.

Predicting and Manipulating Cone Responses to Naturalistic Inputs

Affiliations

Predicting and Manipulating Cone Responses to Naturalistic Inputs

Juan M Angueyra et al. J Neurosci. .

Abstract

Primates explore their visual environment by making frequent saccades, discrete and ballistic eye movements that direct the fovea to specific regions of interest. Saccades produce large and rapid changes in input. The magnitude of these changes and the limited signaling range of visual neurons mean that effective encoding requires rapid adaptation. Here, we explore how macaque cone photoreceptors maintain sensitivity under these conditions. Adaptation makes cone responses to naturalistic stimuli highly nonlinear and dependent on stimulus history. Such responses cannot be explained by linear or linear-nonlinear models but are well explained by a biophysical model of phototransduction based on well-established biochemical interactions. The resulting model can predict cone responses to a broad range of stimuli and enables the design of stimuli that elicit specific (e.g., linear) cone photocurrents. These advances will provide a foundation for investigating the contributions of cone phototransduction and post-transduction processing to visual function.SIGNIFICANCE STATEMENT We know a great deal about adaptational mechanisms that adjust sensitivity to slow changes in visual inputs such as the rising or setting sun. We know much less about the rapid adaptational mechanisms that are essential for maintaining sensitivity as gaze shifts around a single visual scene. We characterize how phototransduction in cone photoreceptors adapts to rapid changes in input similar to those encountered during natural vision. We incorporate these measurements into a quantitative model that can predict cone responses across a broad range of stimuli. This model not only shows how cone phototransduction aids the encoding of natural inputs but also provides a tool to identify the role of the cone responses in shaping those of downstream visual neurons.

Keywords: neural coding; photoreceptors; phototransduction; retina; sensory processing.


Figures

Figure 1.
Figure 1.
Example of cone light-adaptation clamp procedure. Top, The approach. The stimulus to the linear cone phototransduction model is held fixed, whereas the stimulus to the full cone phototransduction model is adjusted until the two models produce similar outputs. Bottom, This process for a step-and-flashes stimulus is shown. Initially, the two stimuli are identical (far left), and the two models produce very different outputs because of adaptation in the full model. Right, Steps in the transformation process are shown, with the final result on the far right.
Figure 2.
Figure 2.
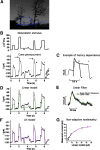
Responses of primate cones to naturalistic stimuli are not well captured by linear or LN models. A, Schematic of eye movements (blue lines) and fixations (blue circles) during free viewing of a natural scene. B, Top, Stimulus emulating the large and frequent changes in mean light intensity experienced by a single cone during free viewing. Bottom, Cone responses to this stimulus are highly nonlinear. For example, the difference between the responses marked by the black arrows is similar to the difference in responses marked by the white arrows (bottom right), although the corresponding stimulus intensities differ 10-fold. C, History dependence exemplified by two responses to the same light intensity but proceeded by different light intensities (asterisks in B). D, Linear model (green trace) scaled to match the final current at the highest light intensity. The model fails to accurately predict responses to most intensities and does not capture the response dynamics following a change in light intensity. E, Estimated single-photon response for the cone in B. The fit to the response (see above, Materials and Methods) was used as a filter to construct a linear estimate of the response in D. F, An LN model (magenta trace) captures the currents at the end of fixations but still fails to capture the dynamics of the response. G, The LN model was built using a nonadaptive nonlinearity constructed by fitting the relation between the measured currents (after baseline subtraction) at the end of fixations (y-axis) and the linear model (x-axis).
Figure 3.
Figure 3.
Gain changes during light adaptation are fast and well tuned to the duration of fixations. A, Stimulus used to probe the kinetics of gain changes during light adaptation. Five flashes (black trace) were superimposed on an adapting step (gray trace); the first, third, and fifth flashes were fixed in time (black), and the second and fourth were delivered with variable delays (Δt) from step onset and offset. Flashes during the step were twofold brighter to partially counteract light adaptation. For this example trace, Δt = 40 ms. B, Average responses to the adapting step alone (gray trace) or in combination with the five flashes (black trace) for Δt = 40 ms. C, Flash responses isolated by subtracting the response to the step alone. The first and fifth flash produced unadapted responses, whereas the smaller and faster response to the third flash (near the end of the step) reflected adaptation. The flashes following step onset and offset elicited responses in transition between the two states. D, Gain changes rapidly at step onset. Gain measurements obtained by dividing the response by the flash strength and normalizing to the gain in darkness; black traces correspond to gain in darkness (far left trace) and to steady-state adapted gain (far right trace). Colored traces correspond to flashes with a variable delay (Δt) from the step onset. The speed of the gain changes was tracked by identifying the peaks and approximating their time course with an exponential function. The time constant of the best fit exponential was τOn = 14 ms (black smooth line). E, Gain changes more slowly at step offset. Black traces correspond to steady-state adapted gain (far left trace) and gain in darkness (far right trace). Colored traces correspond to flashes with a variable delay from the step offset (same delays as in D). The time constant of the best fit exponential was τOff = 86 ms (black smooth line). For D and E, the response to the step without flashes has been displaced and rescaled to compare kinetics (gray traces). F, Collected time constants for gain changes at step onset and offset. Black circle indicates mean, and error bars indicate SEM. Individual cells are shown as gray open circles (n = 15), and the example cell in A–D is shown as the black open circle. All cells lie above the unity line (black dashed line). The time constants for the biophysical model (Fig. 8) are shown by the red triangle (F).
Figure 4.
Figure 4.
Kinetics of onset of Weber adaptation. A, Changes in cone voltage elicited by steps from a common low light intensity to two different high intensities. Superimposed sinusoids probed gain over time following the step in mean intensity. B, Voltage responses to the light step alone (top) and to the sinusoidal stimulus, with step response subtracted (bottom). C, Difference in step (top) and sine (bottom) responses at the two light intensities. D, Mean (± SEM) differences for four cones. E–H, As in A–D, but for a light step from two different starting intensities to a common final intensity.
Figure 5.
Figure 5.
Kinetics of offset of Weber adaptation. A, Changes in cone voltage elicited by steps from a common high light intensity to two different low intensities. Superimposed sinusoids probed gain over time following the step in mean intensity. B, Voltage responses to the light step alone (top) and to the sinusoidal stimulus, with step response subtracted (bottom). C, Difference in step (top) and sine (bottom) responses at the two light intensities. D, Mean (± SEM) differences for four cones. E–H, As in A–D, but for a light step from two different starting intensities to a common final intensity.
Figure 6.
Figure 6.
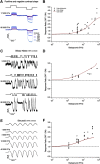
Asymmetric responses to light increments and decrements. A, Average cone photocurrents elicited by light increments and decrements at background light intensities of 17,000 R*/s (top) and 60,000 R*/s (bottom). Decrements produced larger responses than symmetric increments for Weber contrasts above 25% (10 traces averaged at each contrast). The asymmetry was larger as background light intensity increased. B, Ratio of mean negative to mean positive response to 100% contrast steps as a function of mean light intensity. Red line shows prediction of biophysical cone phototransduction model. C, Photocurrents elicited by a binary noise stimulus (100% contrast) at three mean light intensities. D, Ratio of mean negative to mean positive response to binary noise as a function of mean light intensity. Red line shows prediction of biophysical cone model. E, Photocurrents elicited by sinusoidal stimuli (temporal frequency 2.5 Hz, 100% contrast) at four mean light intensities. F, Ratio of peak negative to peak positive response as a function of mean light intensity. Red line is prediction from biophysical cone phototransduction model.
Figure 7.
Figure 7.
Cone voltages and synaptic output exhibit asymmetric responses to light increments and decrements. A, Cone voltage responses (current-clamp recording) elicited by a family of light increments and decrements. B, Horizontal voltage responses elicited by increments and decrements.
Figure 8.
Figure 8.
A biophysical model of phototransduction captures a wide range of cone responses. A, Schematic of phototransduction cascade and corresponding components of the biophysical model; cGMP is constantly synthesized by GC, opening cGMP-gated channels in the membrane. Light-activated opsin (Opsin*) leads to channel closure by activating the G-protein transducin (Gt*) which activates PDE* and decreases the cGMP concentration. Calcium ions (Ca2+) flow into the cone outer segment through the cGMP-gated channels and are extruded through Na+/K+/Ca2+ exchangers in the membrane. Two distinct feedback mechanisms were implemented as calcium-dependent processes that affect the rate of cGMP synthesis (blue line) and the activity of the cGMP-gated channels (red line). B, Fit to the measured cone response to the naturalistic stimulus shown in Figure 2. The model is able to capture both the currents at the end of fixations and the response transients following rapid changes in the stimulus (Table 1). C, The model accurately predicts the amplitude and kinetics of the single-photon response. D–F, Model fit to step and flashes responses from Figure 3. The model exhibits fast changes in gain at step onset (τOn-Model = 13.6 ms) and a slower recovery of gain at step offset (τOff-Model = 180 ms). These time constants are compared with experimental data in Figure 3F. G, Model responses to steps of increasing intensity. H, Dependence of the steady-state current of the model on background light intensity (colored dots). This relation was fit with a Hill equation (Dunn et al., 2007) with a half-maximal background, I½ = 43 500 R*/s, and a Hill exponent, n = 0.77. The fit obtained by Dunn et al. (2007; I½ = 45 000 R*/s and n = 0.7) has been replicated for comparison (gray line). I, Estimated single-photon responses of the model, normalized by the response in darkness, at increasing background light intensities. J, Relation of the peak sensitivity of the model, normalized to the peak sensitivity in darkness, across background light intensity (colored dots). The half-desensitizing background (I0) for the model is 3297 R*/s. The fits obtained in Angueyra and Rieke (2013; I0 = 2250 R*/s, after correcting a calibration error in the original article) and in Cao et al. (2014; I0 = 3330 R*/s, assuming a collecting area of 0.37 μm2 for transversally illuminated cones) have been replicated for comparison (gray lines).
Figure 9.
Figure 9.
A biophysical model of phototransduction with a single adaptation mechanism performs well but does not capture responses to long steps. A, Schematic of phototransduction cascade and corresponding components of the biophysical model; cGMP is constantly synthesized by guanylate cyclase (GC), opening cGMP-gated channels in the membrane. Light-activated opsin (Opsin*) leads to channel closure by activating the G-protein transducin (Gt*), which activates PDE* and decreases the cGMP concentration. Calcium ions (Ca2+) flow into the cone outer segment through the cGMP-gated channels and are extruded through Na+/K+/Ca2+ exchangers in the membrane. Only one feedback mechanism was implemented as a calcium-dependent process that affects the rate of cGMP synthesis. B, Fit to cone response to the naturalistic stimulus shown in Figure 2. The model is able to capture the response transients following rapid changes in the stimulus but slightly misses the currents at the end of fixations (Table 2). C, This model also accurately predicts the amplitude and kinetics of the single-photon response. D–F, Model fit to step and flashes responses from Figure 3. The model exhibits fast changes in gain at step onset (τOn-model = 22.3 ms) and a slower recovery of gain at step offset (τOff-Model = 122.1 ms). G, Model responses to steps of increasing light intensity. H, Dependence of the steady-state current of the model on background light intensity (colored dots). This relation was fit with a Hill equation with a half-maximal background, I½ = 38 785 R*/s, and a Hill exponent, n = 1.07. I, Estimated single-photon responses of the model, normalized by the response in darkness, at increasing background light intensities. J, Relation of the peak sensitivity of the model, normalized to the peak sensitivity in darkness, across background light intensity (colored dots). The half-desensitizing background (I0) for the model is 4198 R*/s.
Figure 10.
Figure 10.
An empirical model of cone responses with a single adaptation mechanism fails to generalize well across cells. A, Schematic of empirical model (Clark et al., 2013) where the stimulus is convolved with a linear filter (Ky) and a dynamic low-pass filter. The time course and amplitude of the low-pass filter are determined by the convolution of the stimulus with a slower linear filter (Kz), which acts as a feedforward mechanism that dynamically modulates the response of the model. B, Fit to cone response (after baseline subtraction) to the naturalistic stimulus shown in Figure 2. The model is able to capture the response transients following rapid changes in the stimulus but is unable to capture current undershoot in light to dark transitions (Table 3). C, This model also underestimates the amplitude of the single-photon response by ∼10-fold. D–F, Model fit to step and flashes responses from Figure 3. The model exhibits fast changes in gain both at step onset (τOn-Model = 12.96 ms) and at step offset (τOff-Model = 45.20 ms). G, Model responses to steps of increasing light intensity. H, Dependence of the steady-state current of the model on background light intensity (colored dots). This relation was fit with a Hill equation with a half-maximal background, I½ = 1613 990 R*/s, and a Hill exponent, n = 1. I, Estimated single-photon responses of the model, normalized by the response in darkness, at increasing background light intensities. J, Relation of the peak sensitivity of the model, normalized to the peak sensitivity in darkness, across background light intensity (colored dots). The half-desensitizing background (I0) for the model is 1,111,790 R*/s.
Figure 11.
Figure 11.
An empirical model of cone responses with a double adaptation mechanism also fails to generalize across cells. A, Schematic of empirical model where the stimulus is convolved with a linear filter (Ky) and a dynamic low-pass filter. The time course and amplitude of the low-pass filter are determined by the successive convolution of the stimulus with two linear filters (Kz and Kzslow), providing a feedforward mechanism that dynamically modulates the response of the model with two different time scales. B, Fit to cone response (after baseline subtraction) to the naturalistic stimulus shown in Figure 2. The model is able to capture the response transients following rapid changes in the stimulus but is still unable to capture current undershoot in light to dark transitions (Table 4). C, This model also underestimates the amplitude of the single-photon response by ∼10-fold. D–F, Model fit to step and flashes responses from Figure 3. The model exhibits fast changes in gain both at step onset (τOn-Model = 13.38 ms) and at step offset (τOff-Model = 34.75 ms). G, Model responses to steps of increasing light intensity. H, Dependence of the steady-state current of the model on background light intensity (colored dots). This relation was fit with a Hill equation with a half-maximal background, I½ = 1428 240 R*/s, and a Hill exponent, n = 1. I, Estimated single-photon responses of the model, normalized by the response in darkness, at increasing background light intensities. J, Relation of the peak sensitivity of the model, normalized to the peak sensitivity in darkness, across background light intensity (colored dots). The half-desensitizing background (I0) for the model is 1,052,580 R*/s.
Figure 12.
Figure 12.
Model responses to binary noise stimuli. A, A 100% contrast binary noise stimulus (top) and cone photocurrent response (bottom), as shown in Figure 6, overlaid with direct fits of each model. B, Ratio of mean negative to mean positive response to binary noise for each model as a function of mean light intensity, derived from fits to example cell in A (top) or from fits to naturalistic stimulus as shown in Figure 2. All models are able to adequately capture the asymmetric responses to this stimulus.
Figure 13.
Figure 13.
Model responses to sinusoidal stimuli. A, A 100% contrast sinusoidal stimulus (top) and cone photocurrent response (bottom), as shown in Figure 6, overlaid with direct fits of each model. B, Ratio of peak negative to peak positive response to the sinusoidal stimulus for each model as a function of mean light intensity, derived from fits to the example cell in A (top) or from fits to naturalistic stimulus, as shown in Figure 2. All models are able to capture the asymmetric responses to this stimulus.
Figure 14.
Figure 14.
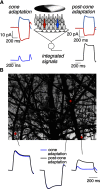
Local cone adaptation shapes integrated responses to spatially structured inputs. A, Top, Examples of predicted responses of two cones to a flashed natural image. Left, Predicted responses from the biophysical model. Right, Predicted responses for a linear cone model. Bottom, Sum of the responses across a collection of cones to illustrate the impact of signal integration, for example, integration within the receptive field of a downstream neuron. Cones were weighted with a Gaussian spatial profile resembling the receptive field of a primate Parasol retinal ganglion cell. The Gaussian SD was 10 cone spacings, meaning that receptive field encompassed several hundred cones. Adaptation in the post-cone-adaptation model operated on the integrated signal, and responses of individual cones depended linearly on light input. B, Predictions of integrated responses for several image patches. Top, The locations of the illustrated patches. Bottom, The integrated responses for adapting (blue) and nonadapting (black) cones.
Figure 15.
Figure 15.
Light-adaptation clamp. A, Left, Illustration of procedure. The stimulus to the full cone model is tuned until the output of this model matches the target output of a linear (nonadapting) cone model. Right, Example of application to sinusoidal stimuli. The original stimulus and response are shown in black and the modified stimulus and response in red. Dashed lines show best fit sinusoids. B, Application to a step-and-flash stimulus. Left, An example cell. Right, Collected data across several cells, plotting the ratio of the amplitude of the responses to flashes before and on top of the step for transformed stimuli (y-axis) and original stimuli (x-axis). The discrete nature of the stimuli originates because these stimuli were delivered using a computer monitor with a 60 Hz frame rate.

Similar articles

Cited by

References

    1. Abrams AB, Hillis JM, Brainard DH (2007) The relation between color discrimination and color constancy: when is optimal adaptation task dependent? Neural Comput 19:2610–2637. 10.1162/neco.2007.19.10.2610 - DOI - PMC - PubMed
    1. Angueyra JM, Rieke F (2013) Origin and effect of phototransduction noise in primate cone photoreceptors. Nat Neurosci 16:1692–1700. 10.1038/nn.3534 - DOI - PMC - PubMed
    1. Arshavsky VY, Lamb TD, Pugh ENJ (2002) G proteins and phototransduction. Annu Rev Physiol 64:153–187. - PubMed
    1. Baylor DA, Hodgkin AL (1974) Changes in time scale and sensitivity in turtle photoreceptors. J Physiol 242:729–758. 10.1113/jphysiol.1974.sp010732 - DOI - PMC - PubMed
    1. Baylor DA, Nunn BJ, Schnapf JL (1984) The photocurrent, noise and spectral sensitivity of rods of the monkey Macaca fascicularis. J Physiol 357:575–607. 10.1113/jphysiol.1984.sp015518 - DOI - PMC - PubMed

Publication types

LinkOut - more resources