Spatiotemporal assessment of health burden and economic losses attributable to short-term exposure to ground-level ozone during 2015-2018 in China
- PMID: 34090376
- PMCID: PMC8178864
- DOI: 10.1186/s12889-021-10751-7
Spatiotemporal assessment of health burden and economic losses attributable to short-term exposure to ground-level ozone during 2015-2018 in China
Abstract
Background: Ground-level ozone (O3) pollution is currently the one of the severe environmental problems in China. Although existing studies have quantified the O3-related health impact and economic loss, few have focused on the acute health effects of short-term exposure to O3 and have been limited to a single temporal and spatial dimension.
Methods: Based on the O3 concentration obtained from ground monitoring networks in 334 Chinese cities in 2015-2018, this study used a two-stage exposure parameter weighted Log-linear exposure-response function to estimate the cause-specific mortality for short-term exposure to O3.
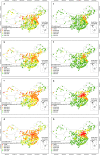
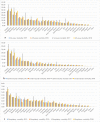
Results: The value of statistical life (VSL) method that were used to calculate the economic loss at the city-level. Our results show that in China, the national all-cause mortality attributed to O3 was 0.27(95% CI: 0.14-0.55) to 0.39 (95% CI: 0.20-0.67) million across 2015-2018. The estimated economic loss caused by O3 was 387.76 (95% CI: 195.99-904.50) to 594.08 (95% CI: 303.34-1140.65) billion CNY, accounting for 0.52 to 0.69% of total reported GDP. Overall, the O3 attributed health and economic burden has begun to decline in China since 2017. However, highly polluted areas still face severe burden, and undeveloped areas suffer from high GDP losses.
Conclusions: There are substantial health impacts and economic losses related to short-term O3 exposure in China. The government should pay attention to the emerging ozone pollution, and continue to strengthen the intervention in traditional priority areas while solving the pollution problem in non-priority areas.
Keywords: China; Economic loss; Exposure factors; Health impact; Ozone; Short-term.
Conflict of interest statement
The authors declare that they have no competing interests.
Figures


Similar articles
-
Ozone pollution in Chinese cities: Assessment of seasonal variation, health effects and economic burden.Environ Pollut. 2019 Apr;247:792-801. doi: 10.1016/j.envpol.2019.01.049. Epub 2019 Jan 29. Environ Pollut. 2019. PMID: 30721870
-
Estimation of health risk and economic loss attributable to PM2.5 and O3 pollution in Jilin Province, China.Sci Rep. 2023 Oct 18;13(1):17717. doi: 10.1038/s41598-023-45062-x. Sci Rep. 2023. PMID: 37853161 Free PMC article.
-
Continuous increases of surface ozone and associated premature mortality growth in China during 2015-2019.Environ Pollut. 2021 Jan 15;269:116183. doi: 10.1016/j.envpol.2020.116183. Epub 2020 Nov 30. Environ Pollut. 2021. PMID: 33288298
-
Short-term exposure to ambient ozone and cardiovascular mortality in China: a systematic review and meta-analysis.Int J Environ Health Res. 2023 Oct;33(10):958-975. doi: 10.1080/09603123.2022.2066070. Epub 2022 Apr 19. Int J Environ Health Res. 2023. PMID: 35438585 Review.
-
Ground-level O3 pollution and its impacts on food crops in China: a review.Environ Pollut. 2015 Apr;199:42-8. doi: 10.1016/j.envpol.2015.01.016. Epub 2015 Jan 22. Environ Pollut. 2015. PMID: 25618365 Review.
Cited by
-
Urban-rural disparities in the association of nitrogen dioxide exposure with cardiovascular disease risk in China: effect size and economic burden.Int J Equity Health. 2024 Feb 6;23(1):22. doi: 10.1186/s12939-024-02117-3. Int J Equity Health. 2024. PMID: 38321458 Free PMC article.
-
Editorial: Ozone as a Driver of Lung Inflammation and Innate Immunity and as a Model for Lung Disease.Front Immunol. 2021 Jun 30;12:714161. doi: 10.3389/fimmu.2021.714161. eCollection 2021. Front Immunol. 2021. PMID: 34276707 Free PMC article. No abstract available.
-
Projecting non-communicable diseases attributable to air pollution in the climate change era: a systematic review.BMJ Open. 2024 May 7;14(5):e079826. doi: 10.1136/bmjopen-2023-079826. BMJ Open. 2024. PMID: 38719294 Free PMC article.
-
Machine-Learning-Based Near-Surface Ozone Forecasting Model with Planetary Boundary Layer Information.Sensors (Basel). 2022 Oct 16;22(20):7864. doi: 10.3390/s22207864. Sensors (Basel). 2022. PMID: 36298214 Free PMC article.
References
-
- USEPA . vol. 1: EPA Research Triangle Park, NC. 2006. Air quality criteria for ozone and related photochemical oxidants; p. 821.
-
- USEPA . Integrated science assessment for ozone and related photochemical oxidants. 2013.
-
- Sakizadeh M, Mohamed MM. Application of spatial analysis to investigate contribution of VOCs to photochemical ozone creation. Environ Sci Pollut Res Int. 2020;27:10459–71. - PubMed
-
- Penrod A, Zhang Y, Wang K, Wu S-Y, Leung LR. Impacts of future climate and emission changes on U.S. air quality. Atmos Environ. 2014;89:533–547. doi: 10.1016/j.atmosenv.2014.01.001. - DOI
Publication types
MeSH terms
Substances
Grants and funding
LinkOut - more resources
Full Text Sources
Medical

