Remote sensing-based water quality index estimation using data-driven approaches: a case study of the Kali River in Uttar Pradesh, India
- PMID: 33897276
- PMCID: PMC8058146
- DOI: 10.1007/s10668-021-01437-6
Remote sensing-based water quality index estimation using data-driven approaches: a case study of the Kali River in Uttar Pradesh, India
Abstract
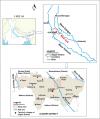
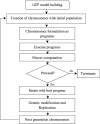
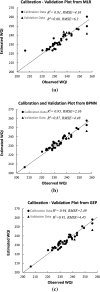
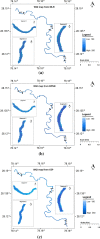
The present study evaluates the water quality status of 6-km-long Kali River stretch that passes through the Aligarh district in Uttar Pradesh, India, by utilizing high-resolution IRS P6 LISS IV imagery. In situ river water samples collected at 40 random locations were analyzed for seven physicochemical and four heavy metal concentrations, and the water quality index (WQI) was computed for each sampling location. A set of 11 spectral reflectance band combinations were formulated to identify the most significant band combination that is related to the observed WQI at each sampling location. Three approaches, namely multiple linear regression (MLR), backpropagation neural network (BPNN) and gene expression programming (GEP), were employed to relate WQI as a function of most significant band combination. Comparative assessment among the three utilized approaches was performed via quantitative indicators such as R 2, RMSE and MAE. Results revealed that WQI estimates ranged between 203.7 and 262.33 and rated as "very poor" status. Results further indicated that GEP performed better than BPNN and MLR approaches and predicted WQI estimates with high R 2 values (i.e., 0.94 for calibration and 0.91 for validation data), low RMSE and MAE values (i.e., 2.49 and 2.16 for calibration and 4.45 and 3.53 for validation data). Moreover, both GEP and BPNN depicted superiority over MLR approach that yielded WQI with R 2 ~ 0.81 and 0.67 for calibration and validation data, respectively. WQI maps generated from the three approaches corroborate the existing pollution levels along the river stretch. In order to examine the significant differences among WQI estimates from the three approaches, one-way ANOVA test was performed, and the results in terms of F-statistic (F = 0.01) and p-value (p = 0.994 > 0.05) revealed WQI estimates as "not significant," reasoned to the small water sample size (i.e., N = 40). The study therefore recommends GEP as more rational and a better alternative for precise water quality monitoring of surface water bodies by producing simplified mathematical expressions.
Keywords: ANN; GEP; Kali River; MLR; Spectral reflectance; WQI.
© The Author(s), under exclusive licence to Springer Nature B.V. 2021.
Figures


Similar articles
-
Assessment of spatial and temporal variations in water quality by the application of multivariate statistical methods in the Kali River, Uttar Pradesh, India.Environ Monit Assess. 2020 May 26;192(6):394. doi: 10.1007/s10661-020-08307-0. Environ Monit Assess. 2020. PMID: 32458103
-
Prediction of weighted arithmetic water quality index for urban water quality using ensemble machine learning model.Chemosphere. 2024 Mar;352:141393. doi: 10.1016/j.chemosphere.2024.141393. Epub 2024 Feb 5. Chemosphere. 2024. PMID: 38325619
-
Evaluation of water quality using water quality index, synthetic pollution index, and GIS technique: a case study of the river Gomti, Lucknow, India.Environ Sci Pollut Res Int. 2022 Nov;29(54):81954-81969. doi: 10.1007/s11356-022-21493-3. Epub 2022 Jun 23. Environ Sci Pollut Res Int. 2022. PMID: 35739453
-
Development of river water quality indices-a review.Environ Monit Assess. 2016 Jan;188(1):58. doi: 10.1007/s10661-015-5050-0. Epub 2015 Dec 28. Environ Monit Assess. 2016. PMID: 26707404 Review.
-
A comprehensive review of water quality indices (WQIs): history, models, attempts and perspectives.Rev Environ Sci Biotechnol. 2023;22(2):349-395. doi: 10.1007/s11157-023-09650-7. Epub 2023 Mar 11. Rev Environ Sci Biotechnol. 2023. PMID: 37234131 Free PMC article. Review.
Cited by
-
Neuro-Particle Swarm Optimization Based In-Situ Prediction Model for Heavy Metals Concentration in Groundwater and Surface Water.Toxics. 2022 Feb 18;10(2):95. doi: 10.3390/toxics10020095. Toxics. 2022. PMID: 35202281 Free PMC article.
References
-
- Abba SI, Said YS, Bashir A. Assessment of water quality changes at two location of Yamuna River using the National Sanitation Foundation of water quality. Journal of Civil Engineering and Environmental Technology. 2015;2(8):730–733.
-
- Akbal F, Gürel L, Bahadır T, Güler İ, Bakan G, Büyükgüngör H. Multivariate statistical techniques for the assessment of surface water quality at the mid-Black Sea coast of Turkey. Water Air Soil Pollution. 2011;216:21–37.
-
- APHA . Standard methods for the examination of water and waste water. 20. American Public Health Association; 1998. p. 1998.
-
- Aras E, Togan V, Berkun M. River water quality management model using genetic algorithm. Environmental Fluid Mechanics. 2007;7:439–450.
-
- ASTM . American society for testing and materials. Published by United States Environmental Protection Agency; 2000. p. 20402.
LinkOut - more resources
Full Text Sources
Other Literature Sources
Research Materials
