Identification of plant leaf phosphorus content at different growth stages based on hyperspectral reflectance
- PMID: 33413120
- PMCID: PMC7792193
- DOI: 10.1186/s12870-020-02807-4
Identification of plant leaf phosphorus content at different growth stages based on hyperspectral reflectance
Abstract
Background: Modern agriculture strives to sustainably manage fertilizer for both economic and environmental reasons. The monitoring of any nutritional (phosphorus, nitrogen, potassium) deficiency in growing plants is a challenge for precision farming technology. A study was carried out on three species of popular crops, celery (Apium graveolens L., cv. Neon), sugar beet (Beta vulgaris L., cv. Tapir) and strawberry (Fragaria × ananassa Duchesne, cv. Honeoye), fertilized with four different doses of phosphorus (P) to deliver data for non-invasive detection of P content.
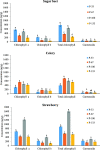
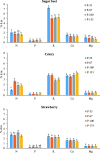
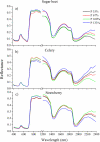
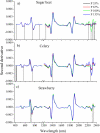
Results: Data obtained via biochemical analysis of the chlorophyll and carotenoid contents in plant material showed that the strongest effect of P availability for plants was in the diverse total chlorophyll content in sugar beet and celery compared to that in strawberry, in which P affects a variety of carotenoid contents in leaves. The measurements performed using hyperspectral imaging, obtained in several different stages of plant development, were applied in a supervised classification experiment. A machine learning algorithm (Backpropagation Neural Network, Random Forest, Naive Bayes and Support Vector Machine) was developed to classify plants from four variants of P fertilization. The lowest prediction accuracy was obtained for the earliest measured stage of plant development. Statistical analyses showed correlations between leaf biochemical constituents, phosphorus fertilization and the mass of the leaf/roots of the plants.
Conclusions: Obtained results demonstrate that hyperspectral imaging combined with artificial intelligence methods has potential for non-invasive detection of non-homogenous phosphorus fertilization on crop levels.
Keywords: Hyperspectral imaging; Phosphorus fertilization; Precision agriculture; Supervised classification.
Conflict of interest statement
The authors declare that they have no competing interests.
Figures


Similar articles
-
Moderate water stress prevents the postharvest decline of ascorbic acid in spinach (Spinacia oleracea L.) but not in spinach beet (Beta vulgaris L.).J Sci Food Agric. 2016 Jul;96(9):2976-80. doi: 10.1002/jsfa.7464. Epub 2015 Oct 19. J Sci Food Agric. 2016. PMID: 26381599
-
In situ hyperspectral data analysis for pigment content estimation of rice leaves.J Zhejiang Univ Sci. 2003 Nov-Dec;4(6):727-33. doi: 10.1631/jzus.2003.0727. J Zhejiang Univ Sci. 2003. PMID: 14566990
-
Hyperspectral imaging for estimating leaf, flower, and fruit macronutrient concentrations and predicting strawberry yields.Environ Sci Pollut Res Int. 2023 Nov;30(53):114166-114182. doi: 10.1007/s11356-023-30344-8. Epub 2023 Oct 19. Environ Sci Pollut Res Int. 2023. PMID: 37858016 Free PMC article.
-
Migrating from Invasive to Noninvasive Techniques for Enhanced Leaf Chlorophyll Content Estimations Efficiency.Crit Rev Anal Chem. 2024;54(7):2583-2598. doi: 10.1080/10408347.2023.2188425. Epub 2023 Mar 30. Crit Rev Anal Chem. 2024. PMID: 36995248 Review.
-
Setting good practices to assess the efficiency of iron fertilizers.Plant Physiol Biochem. 2011 May;49(5):483-8. doi: 10.1016/j.plaphy.2011.02.013. Epub 2011 Feb 24. Plant Physiol Biochem. 2011. PMID: 21398136 Review.
Cited by
-
Cold-tolerant phosphate-solubilizing Pseudomonas strains promote wheat growth and yield by improving soil phosphorous (P) nutrition status.Front Microbiol. 2023 Mar 13;14:1135693. doi: 10.3389/fmicb.2023.1135693. eCollection 2023. Front Microbiol. 2023. PMID: 37025630 Free PMC article.
-
Development of bacteria-based bioorganic phosphate fertilizer enriched with rock phosphate for sustainable wheat production.Front Microbiol. 2024 Jul 23;15:1361574. doi: 10.3389/fmicb.2024.1361574. eCollection 2024. Front Microbiol. 2024. PMID: 39109207 Free PMC article.
-
Modeling the spatial-spectral characteristics of plants for nutrient status identification using hyperspectral data and deep learning methods.Front Plant Sci. 2023 Oct 16;14:1209500. doi: 10.3389/fpls.2023.1209500. eCollection 2023. Front Plant Sci. 2023. PMID: 37908836 Free PMC article.
-
Visible near-infrared hyperspectral imaging and supervised classification for the detection of small intestinal necrosis tissue in vivo.Biomed Opt Express. 2022 Oct 27;13(11):6061-6080. doi: 10.1364/BOE.470202. eCollection 2022 Nov 1. Biomed Opt Express. 2022. PMID: 36733734 Free PMC article.
-
The use of photosynthetic pigments and SPAD can help in the selection of bean genotypes under fertilization organic and mineral.Sci Rep. 2023 Dec 18;13(1):22610. doi: 10.1038/s41598-023-49582-4. Sci Rep. 2023. PMID: 38114650 Free PMC article.
References
-
- Li Y, Wang T, Li J, Ao Y. Effect of phosphorus on celery growth and nutrient uptake under different calcium and magnesium levels in substrate culture. Hortic Sci. 2010;37:99–108. doi: 10.17221/81/2009-HORTSCI. - DOI
-
- Barłóg P, Grzebisz W, Feć M, Łukowiak R, Szczepaniak W. Row method of sugar beet (Beta vulgaris L.) fertilization with multicomponent fertilizer based on urea-ammonium nitrate solution as a way to increase nitrogen efficiency. J Cent Eur Agric. 2010;11:225–234.
-
- Salimpour S, Khavazi K, Nadian H, Besharati H, Miransari M. Enhancing phosphorous availability to canola (Brassica napus L.) using P solubilizing and sulfur oxidizing bacteria. Aust J Crop Sci. 2010;4:330–334.
Publication types
MeSH terms
Substances
Grants and funding
LinkOut - more resources
Full Text Sources
Other Literature Sources

