The interrelationship between the face and vocal tract configuration during audiovisual speech
- PMID: 33293422
- PMCID: PMC7768679
- DOI: 10.1073/pnas.2006192117
The interrelationship between the face and vocal tract configuration during audiovisual speech
Abstract
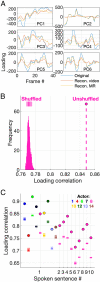
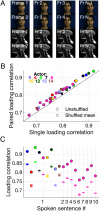
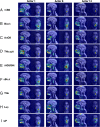
It is well established that speech perception is improved when we are able to see the speaker talking along with hearing their voice, especially when the speech is noisy. While we have a good understanding of where speech integration occurs in the brain, it is unclear how visual and auditory cues are combined to improve speech perception. One suggestion is that integration can occur as both visual and auditory cues arise from a common generator: the vocal tract. Here, we investigate whether facial and vocal tract movements are linked during speech production by comparing videos of the face and fast magnetic resonance (MR) image sequences of the vocal tract. The joint variation in the face and vocal tract was extracted using an application of principal components analysis (PCA), and we demonstrate that MR image sequences can be reconstructed with high fidelity using only the facial video and PCA. Reconstruction fidelity was significantly higher when images from the two sequences corresponded in time, and including implicit temporal information by combining contiguous frames also led to a significant increase in fidelity. A "Bubbles" technique was used to identify which areas of the face were important for recovering information about the vocal tract, and vice versa, on a frame-by-frame basis. Our data reveal that there is sufficient information in the face to recover vocal tract shape during speech. In addition, the facial and vocal tract regions that are important for reconstruction are those that are used to generate the acoustic speech signal.
Keywords: PCA; audiovisual; speech.
Copyright © 2020 the Author(s). Published by PNAS.
Conflict of interest statement
The authors declare no competing interest.
Figures


Similar articles
-
Processing communicative facial and vocal cues in the superior temporal sulcus.Neuroimage. 2020 Nov 1;221:117191. doi: 10.1016/j.neuroimage.2020.117191. Epub 2020 Jul 23. Neuroimage. 2020. PMID: 32711066
-
Mouth and Voice: A Relationship between Visual and Auditory Preference in the Human Superior Temporal Sulcus.J Neurosci. 2017 Mar 8;37(10):2697-2708. doi: 10.1523/JNEUROSCI.2914-16.2017. Epub 2017 Feb 8. J Neurosci. 2017. PMID: 28179553 Free PMC article.
-
Can you McGurk yourself? Self-face and self-voice in audiovisual speech.Psychon Bull Rev. 2012 Feb;19(1):66-72. doi: 10.3758/s13423-011-0176-8. Psychon Bull Rev. 2012. PMID: 22033983
-
Some behavioral and neurobiological constraints on theories of audiovisual speech integration: a review and suggestions for new directions.Seeing Perceiving. 2011;24(6):513-39. doi: 10.1163/187847611X595864. Epub 2011 Sep 29. Seeing Perceiving. 2011. PMID: 21968081 Free PMC article. Review.
-
The importance of vocal affect to bimodal processing of emotion: implications for individuals with traumatic brain injury.J Commun Disord. 2009 Jan-Feb;42(1):1-17. doi: 10.1016/j.jcomdis.2008.06.001. Epub 2008 Jul 9. J Commun Disord. 2009. PMID: 18692197 Review.
Cited by
-
Neural indicators of articulator-specific sensorimotor influences on infant speech perception.Proc Natl Acad Sci U S A. 2021 May 18;118(20):e2025043118. doi: 10.1073/pnas.2025043118. Proc Natl Acad Sci U S A. 2021. PMID: 33980713 Free PMC article.
-
Faces and Voices Processing in Human and Primate Brains: Rhythmic and Multimodal Mechanisms Underlying the Evolution and Development of Speech.Front Psychol. 2022 Mar 30;13:829083. doi: 10.3389/fpsyg.2022.829083. eCollection 2022. Front Psychol. 2022. PMID: 35432052 Free PMC article. Review.
-
Modulation transfer functions for audiovisual speech.PLoS Comput Biol. 2022 Jul 19;18(7):e1010273. doi: 10.1371/journal.pcbi.1010273. eCollection 2022 Jul. PLoS Comput Biol. 2022. PMID: 35852989 Free PMC article.
-
A PCA-Based Active Appearance Model for Characterising Modes of Spatiotemporal Variation in Dynamic Facial Behaviours.Front Psychol. 2022 May 26;13:880548. doi: 10.3389/fpsyg.2022.880548. eCollection 2022. Front Psychol. 2022. PMID: 35719501 Free PMC article.
References
-
- Erber N. P., Use of hearing aids by older people: Influence of non-auditory factors (vision, manual dexterity). Int. J. Audiol. 42 (suppl. 2), S21–S25 (2003). - PubMed
-
- Sumby W. H., Pollack I., Visual contribution to speech intelligibility in noise. J. Acoust. Soc. Am. 26, 212–215 (1954).
-
- Cherry E. C., Some experiments on the recognition of speech, with one and with 2 ears. J. Acoust. Soc. Am. 25, 975–979 (1953).
Publication types
MeSH terms
Grants and funding
LinkOut - more resources
Full Text Sources

