Three-dimensional super-resolution fluorescence imaging of DNA
- PMID: 32719468
- PMCID: PMC7385144
- DOI: 10.1038/s41598-020-68892-5
Three-dimensional super-resolution fluorescence imaging of DNA
Abstract
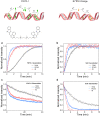
Recent advances in fluorescence super-resolution microscopy are providing important insights into details of cellular structures. To acquire three dimensional (3D) super-resolution images of DNA, we combined binding activated localization microscopy (BALM) using fluorescent double-stranded DNA intercalators and optical astigmatism. We quantitatively establish the advantage of bis- over mono-intercalators before demonstrating the approach by visualizing single DNA molecules stretched between microspheres at various heights. Finally, the approach is applied to the more complex environment of intact and damaged metaphase chromosomes, unravelling their structural features.
Conflict of interest statement
The authors declare no competing interests.
Figures


Similar articles
-
ChromoTrace: Computational reconstruction of 3D chromosome configurations for super-resolution microscopy.PLoS Comput Biol. 2018 Mar 9;14(3):e1006002. doi: 10.1371/journal.pcbi.1006002. eCollection 2018 Mar. PLoS Comput Biol. 2018. PMID: 29522506 Free PMC article.
-
Single-Molecule Micromanipulation and Super-Resolution Imaging Resolve Nanodomains Underlying Chromatin Folding in Mitotic Chromosomes.ACS Nano. 2022 May 24;16(5):8030-8039. doi: 10.1021/acsnano.2c01025. Epub 2022 Apr 29. ACS Nano. 2022. PMID: 35485433
-
3D super-resolution imaging by localization microscopy.Methods Mol Biol. 2015;1232:123-36. doi: 10.1007/978-1-4939-1752-5_11. Methods Mol Biol. 2015. PMID: 25331133
-
Recent advances in super-resolution fluorescence imaging and its applications in biology.J Genet Genomics. 2013 Dec 20;40(12):583-95. doi: 10.1016/j.jgg.2013.11.003. Epub 2013 Nov 23. J Genet Genomics. 2013. PMID: 24377865 Review.
-
Super-resolution fluorescence imaging of directly labelled DNA: from microscopy standards to living cells.J Microsc. 2013 Jul;251(1):1-4. doi: 10.1111/jmi.12054. Epub 2013 May 23. J Microsc. 2013. PMID: 23700988 Review.
Cited by
-
Three-Dimensional Culture of Rhipicephalus (Boophilus) microplus BmVIII-SCC Cells on Multiple Synthetic Scaffold Systems and in Rotating Bioreactors.Insects. 2021 Aug 19;12(8):747. doi: 10.3390/insects12080747. Insects. 2021. PMID: 34442313 Free PMC article.
-
Toward Sub-Diffraction Imaging of Single-DNA Molecule Sensors Based on Stochastic Switching Localization Microscopy.Sensors (Basel). 2020 Nov 21;20(22):6667. doi: 10.3390/s20226667. Sensors (Basel). 2020. PMID: 33233370 Free PMC article. Review.
-
Photochemical Mechanisms of Fluorophores Employed in Single-Molecule Localization Microscopy.Angew Chem Int Ed Engl. 2023 Jan 2;62(1):e202204745. doi: 10.1002/anie.202204745. Epub 2022 Nov 17. Angew Chem Int Ed Engl. 2023. PMID: 36177530 Free PMC article. Review.
References
Publication types
MeSH terms
Substances
Grants and funding
LinkOut - more resources
Full Text Sources
Miscellaneous

