A simple model for glioma grading based on texture analysis applied to conventional brain MRI
- PMID: 32413034
- PMCID: PMC7228074
- DOI: 10.1371/journal.pone.0228972
A simple model for glioma grading based on texture analysis applied to conventional brain MRI
Abstract
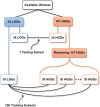
Accuracy of glioma grading is fundamental for the diagnosis, treatment planning and prognosis of patients. The purpose of this work was to develop a low-cost and easy-to-implement classification model which distinguishes low-grade gliomas (LGGs) from high-grade gliomas (HGGs), through texture analysis applied to conventional brain MRI. Different combinations of MRI contrasts (T1Gd and T2) and one segmented glioma region (necrotic and non-enhancing tumor core, NCR/NET) were studied. Texture features obtained from the gray level size zone matrix (GLSZM) were calculated. An under-sampling method was proposed to divide the data into different training subsets and subsequently extract complementary information for the creation of distinct classification models. The sensitivity, specificity and accuracy of the models were calculated, and the best model explicitly reported. The best model included only three texture features and reached a sensitivity, specificity and accuracy of 94.12%, 88.24% and 91.18%, respectively. According to the features of the model, when the NCR/NET region was studied, HGGs had a more heterogeneous texture than LGGs in the T1Gd images, and LGGs had a more heterogeneous texture than HGGs in the T2 images. These novel results partially contrast with results from the literature. The best model proved to be useful for the classification of gliomas. Complementary results showed that the heterogeneity of gliomas depended on the MRI contrast studied. The chosen model stands out as a simple, low-cost, easy-to-implement, reproducible and highly accurate glioma classifier. Importantly, it should be accessible to populations with reduced economic and scientific resources.
Conflict of interest statement
The authors have declared that no competing interests exist.
Figures


Similar articles
-
Intergrating conventional MRI, texture analysis of dynamic contrast-enhanced MRI, and susceptibility weighted imaging for glioma grading.Acta Radiol. 2019 Jun;60(6):777-787. doi: 10.1177/0284185118801127. Epub 2018 Sep 23. Acta Radiol. 2019. PMID: 30244590
-
Grading of Gliomas by Using Radiomic Features on Multiple Magnetic Resonance Imaging (MRI) Sequences.Med Sci Monit. 2017 May 7;23:2168-2178. doi: 10.12659/msm.901270. Med Sci Monit. 2017. PMID: 28478462 Free PMC article.
-
Optimizing Texture Retrieving Model for Multimodal MR Image-Based Support Vector Machine for Classifying Glioma.J Magn Reson Imaging. 2019 May;49(5):1263-1274. doi: 10.1002/jmri.26524. Epub 2019 Jan 9. J Magn Reson Imaging. 2019. PMID: 30623514
-
Magnetic resonance perfusion for differentiating low-grade from high-grade gliomas at first presentation.Cochrane Database Syst Rev. 2018 Jan 22;1(1):CD011551. doi: 10.1002/14651858.CD011551.pub2. Cochrane Database Syst Rev. 2018. PMID: 29357120 Free PMC article. Review.
-
The diagnostic performance of magnetic resonance spectroscopy in differentiating high-from low-grade gliomas: A systematic review and meta-analysis.Eur Radiol. 2016 Aug;26(8):2670-84. doi: 10.1007/s00330-015-4046-z. Epub 2015 Oct 15. Eur Radiol. 2016. PMID: 26471274 Review.
Cited by
-
A Novel System for Precise Grading of Glioma.Bioengineering (Basel). 2022 Oct 7;9(10):532. doi: 10.3390/bioengineering9100532. Bioengineering (Basel). 2022. PMID: 36290500 Free PMC article.
-
Differentiating glioblastoma multiforme from cerebral lymphoma: application of advanced texture analysis of quantitative apparent diffusion coefficients.Neuroradiol J. 2020 Oct;33(5):428-436. doi: 10.1177/1971400920937382. Epub 2020 Jul 6. Neuroradiol J. 2020. PMID: 32628089 Free PMC article.
-
Fractal dimension: analyzing its potential as a neuroimaging biomarker for brain tumor diagnosis using machine learning.Front Physiol. 2023 Jul 17;14:1201617. doi: 10.3389/fphys.2023.1201617. eCollection 2023. Front Physiol. 2023. PMID: 37528895 Free PMC article.
-
Bias and Class Imbalance in Oncologic Data-Towards Inclusive and Transferrable AI in Large Scale Oncology Data Sets.Cancers (Basel). 2022 Jun 12;14(12):2897. doi: 10.3390/cancers14122897. Cancers (Basel). 2022. PMID: 35740563 Free PMC article. Review.
-
Predictive Ki-67 Proliferation Index of Cervical Squamous Cell Carcinoma Based on IVIM-DWI Combined with Texture Features.Contrast Media Mol Imaging. 2021 Jan 14;2021:8873065. doi: 10.1155/2021/8873065. eCollection 2021. Contrast Media Mol Imaging. 2021. PMID: 33531882 Free PMC article.
References
-
- Wang Q, Li Q, Mi R, Ye H, Zhang H, Chen B, et al. Radiomics Nomogram Building From Multiparametric MRI to Predict Grade in Patients With Glioma: A Cohort Study. J Magn Reson Imaging. 2018. - PubMed
Publication types
MeSH terms
Grants and funding
LinkOut - more resources
Full Text Sources
Medical

