Therapeutic role of miR-19a/19b in cardiac regeneration and protection from myocardial infarction - PubMed Skip to main page content
U.S. flag

An official website of the United States government

Dot gov

The .gov means it’s official.
Federal government websites often end in .gov or .mil. Before sharing sensitive information, make sure you’re on a federal government site.

Https

The site is secure.
The https:// ensures that you are connecting to the official website and that any information you provide is encrypted and transmitted securely.

Access keys NCBI Homepage MyNCBI Homepage Main Content Main Navigation
. 2019 Apr 17;10(1):1802.
doi: 10.1038/s41467-019-09530-1.

Therapeutic role of miR-19a/19b in cardiac regeneration and protection from myocardial infarction

Affiliations

Therapeutic role of miR-19a/19b in cardiac regeneration and protection from myocardial infarction

Feng Gao et al. Nat Commun. .

Abstract

The primary cause of heart failure is the loss of cardiomyocytes in the diseased adult heart. Previously, we reported that the miR-17-92 cluster plays a key role in cardiomyocyte proliferation. Here, we report that expression of miR-19a/19b, members of the miR-17-92 cluster, is induced in heart failure patients. We show that intra-cardiac injection of miR-19a/19b mimics enhances cardiomyocyte proliferation and stimulates cardiac regeneration in response to myocardial infarction (MI) injury. miR-19a/19b protected the adult heart in two distinctive phases: an early phase immediately after MI and long-term protection. Genome-wide transcriptome analysis demonstrates that genes related to the immune response are repressed by miR-19a/19b. Using an adeno-associated virus approach, we validate that miR-19a/19b reduces MI-induced cardiac damage and protects cardiac function. Finally, we confirm the therapeutic potential of miR-19a/19b in protecting cardiac function by systemically delivering miR-19a/19b into mice post-MI. Our study establishes miR-19a/19b as potential therapeutic targets to treat heart failure.


Conflict of interest statement

The authors declare no competing interests.

Figures
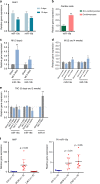
Fig. 1
Fig. 1
Expression of mir-19a/miR-19b in the heart and cardiomyocytes. a qRT-PCR of miR-19a and miR-19b at 2 and 12 days postnatal mouse hearts. n = 3 mice. b In isolated adult cardiomyocytes and non-cardiomyocytes, qRT-PCR detection of the expression of miR-19a. n = 3 mice. c, d In mouse myocardial infarction (MI) model, qRT-PCR detection of the expression of miR-19a and miR-19b (c) at 3 days post-MI (n = 6 mice) and (d) at 2 weeks and 4 weeks post-MI. n = 3–6 mice. e In mouse transverse aortic constriction (TAC) induced cardiac hypertrophy model, qRT-PCR detection of the expression of miR-19a, miR-19b, and miR-21 at 3 days and 2 weeks post-TAC. Expression of miR-21 was considered as positive control. n = 2–3 mice. f In human heart disease samples, qRT-PCR detection of the expression of pri-mir19a in hearts with dilated cardiomyopathy (DCM) and coronary artery disease (CAD). The expression of ANF (encoded by Nppa) was considered as positive control. All panels, statistical significance was calculated using Student’s t-test and data are presented as means ± s.e.m. *p < 0.05, **p < 0.01 vs. control. Source data are provided as a Source Data file
Fig. 2
Fig. 2
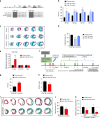
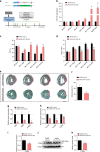
Direct injection of miR-19a/19b mimics protects the heart from myocardial infarction. a Gene structure of the miR-17–92 cluster and conserved sequences of miR-19a and miR-19b across species. Seed sequences are highlighted. b Echocardiography analyses of mice with intra-cardiac injection of individual miR-19a, miR-19b or control mimics at 5 days, 2, 7, and 9 weeks post MI. n = 3–6 mice. c Transverse sections of miR-19a, miR-19b or control mimic injected hearts at 2 months post MI. Sirius red/fast green marks myocardium (green) and scar (red). Scale bar = 2 mm. d Quantification of the size of scar. n = 3–4 mice. e qRT-PCR of miR-19a in heart at 4 days, 2 months, and 1 year after intra-cardiac injection of miR-19a/19b mimics. n = 3–5 mice. f Experimental design. Mice receiving miR-19a/19b mimic post-MI were assessed for cardiac function short term and long term, as well as morphological assessment. g Left ventricular fractional shortening (FS%) and (h) LV internal dimension at end-systole (LVID;s). n = 5 mice in control mimic group, n = 10 mice in miR-19a/19b mimic group. i Representative images of series of transverse sections after injection of miR-19a/19b mimics compared to control group at 2 months after MI. Sirius red/fast green collagen staining marks myocardium (green) and scar (red). Scale bar = 2 mm. j Quantification of the size of scar in the hearts after injection of miR-19a/19b mimics. n = 5 control mice; n = 4 miR-19a/19b mimic-treated mice. k qRT-PCR detection of expression of pathological remodeling marker genes BNP (encoded by Nppb) and β-MHC (encoded by Myh7). n = 5 control mice; n = 6 miR-19a/19b mimic-treated mice. Statistical significance was calculated using Student’s t-test in b, d, e, g, h, j, and k and data are presented as means ± s.e.m. *p < 0.05, **p < 0.01 vs. control. Source data are provided as a Source Data file
Fig. 3
Fig. 3
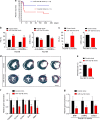
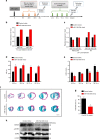
Short-term and long-term cardiac protection after myocardial infarction and injection of miR-19a/19b mimics. a Kaplan–Meier survival curves after injection of miR-19a/19b mimics compared to injection of control mimic after MI injury. n = 11 mice mimic control; n = 13 mice, miR-19a/19b mimics. b, c Echocardiography analyses of cardiac function after miR-19a/19b mimic injection at both short term of 2–4 weeks and 4 months (b) and long term of 12 months (c) after MI injury compared to their control group. FS% left ventricular fractional shortening. LVIDs LV internal dimension at end-systole. n = 3–12 mice. d Representative images of series of transverse sections after injection of miR-19a/19b mimics compared to control mimic at long term of 12 months after MI injury. Sirius red/fast green collagen staining marks myocardium (green) and scar (red). Scale bar = 2 mm. e Quantification of the size of scar after injection of miR-19a/19b mimics compared to control mice at long term of 12 months after MI injury. n = 3 mice. f qRT-PCR detection of expression of fibrotic remodeling marker genes 4 days after mimic injection and MI injury. n = 3–7 mice. g qRT-PCR detection of expression of pathological remodeling marker genes 12 months after mimic injection and MI injury. n = 4–6 mice. Statistical significance was calculated using Student’s t-test in b, c, e, f, and g and data are presented as means ± s.e.m. *p < 0.05, **p < 0.01 vs. control. Source data are provided as a Source Data file
Fig. 4
Fig. 4
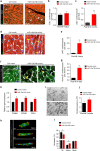
miR-19a/19b promotes cardiomyocyte proliferation after myocardial infarction. a Immunofluorescence staining of EdU incorporation on transverse sections of adult hearts injected with miR-19a/19b or control mimic 2 months post MI injury. EdU labels proliferating cells (green); cardiac troponin T (cTNT) marks cardiomyocytes (red); wheat germ agglutinin (WGA) marks cell surfaces (white) and DAPI labels nuclei (blue). Arrows point to EdU-positive signal in cardiomyocytes and stars mark EdU-positive signal in non-cardiomyocytes. Scale bar = 48 μm. b, c Quantification of percentages of EdU-positive cardiomyocytes. n = 5 hearts for control group, n = 3 hearts for miR-19a/19b mimics group, 25–30 fields per heart for each group. d Immunofluorescence staining of pH3 on transverse sections of adult hearts injected with miR-19a/19b or control mimic 4 days post MI injury. pH3 (green); α-actinin (red); WGA (white) and DAPI (blue). pH3-positive signal in cardiomyocytes (arrows) and non-cardiomyocytes (asterisk) are marked. Scale bar = 20 μm. e Quantification of pH3-positive cardiomyocytes. n = 3 hearts for each group, 6–8 fields per heart for each group. f Immunofluorescence staining of Aurora B adult hearts. Aurora B (red); α-ACTININ (green); WGA (white); and DAPI (blue). Arrows point to Aurora B-positive signals in cardiomyocytes. Scale bar = 20 μm. g Quantification of Aurora B-positive cardiomyocytes. n = 4 hearts for each group, five sections for each heart. h qRT-PCR of cell cycle marker genes. n = 4–5 hearts. i Representative images of cardiomyocytes isolated from adult hearts injected with control or miR-19a/19b mimic 3 weeks post MI injury. Scale bars = 100 μm. j Quantification of the number of cardiomyocytes. Approximately 4 × 103 cardiomyocytes were counted per group, using eight independent heart samples. k Immunostaining of isolated cardiomyocytes with Connexin 43 (red), α-actinin (green), and DAPI (blue). Scale bars = 10 μm. l For nucleation, ~1 × 103 cardiomyocytes were counted per sample, using nine control hearts and six miR-19a/19b mimic-treated hearts. Statistical significance was calculated using Student’s t-test in b, c, e, g, h, j, and l and data are presented as means ± s.e.m. *p < 0.05, **p < 0.01 vs. control. Source data are provided as a Source Data file
Fig. 5
Fig. 5
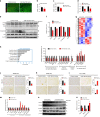
miR-19a/19b reduces myocardial infarction-induced inflammation and cell death. a TUNEL staining (red) on transverse sections of adult hearts injected with miR-19a/19b or control mimic 4 days after MI. cTNT marks cardiomyocytes (green) and DAPI marks nuclei (blue). Scale bars = 48 μm. b, c Quantification of TUNEL-positive cardiomyocytes (b) and non-cardiomyocytes (c). n = 4 hearts, 6–14 fields per heart. d qRT-PCR detection of apoptosis gene expression. n = 3–7 hearts. e Western blot analysis of protein levels of PTEN, BIM, cleaved Caspase 3, and BAX in adult hearts. f Quantification of Western blot band density. n = 4 hearts. g Hierarchical clustering of 544 differentially expressed genes between miR-19a/19b and control mimic injected hearts 4 days after MI. Red and blue colors indicate up-regulated or down-regulated genes. h Gene ontology (GO) analysis of 393 down-regulated genes. (i) qRT-PCR analysis of expression of down-regulated genes related to immune response, cell death, and fibrosis. Up-regulated genes were also examined. NPPA serves as a control for cardiomyopathy. n = 3 hearts. j–l Immunohistochemistry analysis of M1 markers, (j) CD80, (k) iNOS, and M2 marker (l) Arg-1 in adult hearts injected with miR-19a/19b or control mimics at 48 and 72 h post MI. n = 4–8 hearts. Scale bars= 50 μm. m qRT-PCR analysis of expression of M1 and M2 marker genes and potential target genes in adult hearts. n = 3–6 hearts. n Western blot analysis of protein levels of SOCS and STAT3 pathways in adult hearts. o Quantification of Western blot band density. n = 3–4 hearts. Statistical significance was calculated using Student’s t-test in b, c, d, f, i, m, and o and data are presented as means ± s.e.m. *p < 0.05, **p < 0.01 vs. control. Source data are provided as a Source Data file
Fig. 6
Fig. 6
AAV9-mediated overexpression of miR-19a/19b protects the heart from myocardial infarction. a Schematic of the AAV9-miR-19a/19b and AAV9-Control constructs and the experimental procedure of the AAV9-miR-19a/19b therapeutic trial in adult mice after myocardial infarction injury. ITR inverted terminal repeat. b qRT-PCR detection of the level of miR-19a in heart after intra-cardiac injection of AAV9-miR-19a/19b 3 months post-MI. n = 2–3 hearts. c, d Echocardiography analyses of cardiac function after intra-cardiac injection of AAV9-miR-19a/19b versus control 3 months post-MI. AAV9-miR-19a/19b injection (c) significantly increased left ventricular fractional shortening (FS%) and (d) decreased LV internal dimension at end-systole LVID;s. n = 4–7 hearts. e Representative images of series of transverse sections after intra-cardiac injection of AAV9-miR-19a/19b versus control at 3 months post-MI. Sirius red/fast green collagen staining marks myocardium (green) and scar (red). Scale bar = 2 mm. f Quantification of the scar size of the heart sections. n = 4 hearts. g–i qRT-PCR detection of expression of (g) cardiomyopathy marker genes, (h) fibrosis marker genes and (i) miR-19 target gene PTEN in hearts after intra-cardiac AAV9-miR-19a/19b injection 3 months post-MI. n = 4–6 hearts. j Western blot analysis of protein level of PTEN in hearts after intra-cardiac AAV9-miR-19a/19b injection 7 days post-MI. k Quantification of Western blot band density. n = 3 hearts. Statistical significance was calculated using Student’s t-test in b, c, d, f, g, h, i, and k and data are presented as means ± s.e.m. *p < 0.05, **p < 0.01 vs. control. Source data are provided as a Source Data file
Fig. 7
Fig. 7
Therapeutic potential of miR-19a/19b in treating infarcted hearts. a Schematic of tail-vein injection of RNALancerII-delivered miRNA mimics post myocardial infarction (MI). b qRT-PCR detection of miR-19a and miR-19b expression in the heart 6 h after injection post MI injury. n = 1 heart each group. c qRT-PCR detection of miR-19a and miR-19b expression in the heart at 24 h after injection with or without MI injury. n = 2 hearts each group. d, e Echocardiography analyses of cardiac function after tail-vein injection of miR-19a/19b and control mimic at different time points post MI. d FS%, left ventricular fractional shortening. e LVIDs LV internal dimension at end-systole. n = 3–10 mice. f Representative images of series of transverse heart sections after tail-vein injection of miR-19a/19b or control mimics post MI. Sirius red/Fast green collagen staining marks myocardium (green) and scar (red). g Quantification of the size of scar. n = 3 hearts. h Western blot analysis of protein levels of SOCS and STAT3 in the heart 24 h after tail-vein injection of miR-19a/19b or control mimics post MI. Statistical significance was calculated using Student’s t-test in d, f, and g and data are presented as means ± s.e.m. *p < 0.05, **p < 0.01 vs. control. Source data are provided as a Source Data file

Similar articles

Cited by

References

    1. Xin M, Olson EN, Bassel-Duby R. Mending broken hearts: cardiac development as a basis for adult heart regeneration and repair. Nat. Rev. Mol. Cell Biol. 2013;14:529–541. doi: 10.1038/nrm3619. - DOI - PMC - PubMed
    1. van Rooij E. Cardiac repair after myocardial infarction. N. Engl. J. Med. 2016;374:85–87. doi: 10.1056/NEJMcibr1512011. - DOI - PubMed
    1. Porrello ER, et al. Transient regenerative potential of the neonatal mouse heart. Science. 2011;331:1078–1080. doi: 10.1126/science.1200708. - DOI - PMC - PubMed
    1. Nakada Y, et al. Hypoxia induces heart regeneration in adult mice. Nature. 2017;541:222–227. doi: 10.1038/nature20173. - DOI - PubMed
    1. Kennedy-Lydon, T. & Rosenthal, N. Cardiac regeneration: all work and no repair? Sci. Transl. Med. 9, eaad9019 (2017). - PubMed

Publication types

MeSH terms