Evaluation of endoscopic visible light spectroscopy: comparison with microvascular oxygen tension measurements in a porcine model
- PMID: 30819196
- PMCID: PMC6396526
- DOI: 10.1186/s12967-019-1802-x
Evaluation of endoscopic visible light spectroscopy: comparison with microvascular oxygen tension measurements in a porcine model
Abstract
Background: Visible light spectroscopy (VLS) is a technique used to measure the mucosal oxygen saturation during upper gastrointestinal endoscopy to evaluate mucosal ischemia, however in vivo validation is lacking. We aimed to compare VLS measurements with a validated quantitative microvascular oxygen tension (μPO2) measurement technique.
Methods: Simultaneous VLS measurements and μPO2 measurements were performed on the small intestine of five pigs. First, simultaneous measurements were performed at different FiO2 values (18%-100%). Thereafter, the influence of bile was assessed by comparing VLS measurements in the presence of bile and without bile. Finally, simultaneous VLS and μPO2 measurements were performed from the moment a lethal dose potassium chloride intravenously was injected.
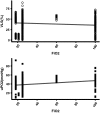
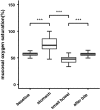
Results: In contrast to μPO2 values that increased with increasing FiO2, VLS values decreased. Both measurements correlated poorly with R2 = 0.39, intercept 18.5, slope 0.41 and a bias of - 16%. Furthermore, the presence of bile influenced VLS values significantly (median (IQR)) before bile application 57.5% (54.8-59.0%) versus median with bile mixture of the stomach 73.5% (66.8-85.8), p = < 2.2 * 10-16; median with bile mixture of small bowel 47.6% (41.8-50.8) versus median after bile removal 57.0% (54.7-58.6%), p = < 2.2 * 10-16). Finally, the VLS mucosal oxygen saturation values did not decrease towards a value of 0 in the first 25 min of asystole in contrast to the μPO2 values.
Conclusions: These results suggest that VLS measures the mixed venous oxygen saturation rather than mucosal capillary hemoglobin oxygen saturation. Further research is needed to establish if the mixed venous compartment is optimal to assess gastrointestinal ischemia.
Keywords: Chronic mesenteric ischemia; Diagnostics; Microvascular oxygen tension measurements; Visible light spectroscopy.
Figures


Similar articles
-
Detection of mesenteric ischemia by means of endoscopic visible light spectroscopy after luminal feeding.Gastrointest Endosc. 2019 Jan;89(1):94-102. doi: 10.1016/j.gie.2018.07.024. Epub 2018 Jul 25. Gastrointest Endosc. 2019. PMID: 30055157
-
Intraobserver and interobserver reliability of visible light spectroscopy during upper gastrointestinal endoscopy.Expert Rev Med Devices. 2018 Aug;15(8):605-610. doi: 10.1080/17434440.2018.1496818. Epub 2018 Jul 18. Expert Rev Med Devices. 2018. PMID: 29973094
-
Gastroscopy assisted laser Doppler flowmetry and visible light spectroscopy in patients with chronic mesenteric ischemia.Scand J Clin Lab Invest. 2019 Nov;79(7):541-549. doi: 10.1080/00365513.2019.1672084. Epub 2019 Sep 27. Scand J Clin Lab Invest. 2019. PMID: 31560225
-
Use of visible light spectroscopy to diagnose chronic gastrointestinal ischemia and predict response to treatment.Clin Gastroenterol Hepatol. 2015 Jan;13(1):122-30.e1. doi: 10.1016/j.cgh.2014.07.012. Epub 2014 Jul 11. Clin Gastroenterol Hepatol. 2015. PMID: 25019697
-
Endoscopic reflectance spectrophotometry and visible light spectroscopy in clinical gastrointestinal studies.Dig Dis Sci. 2008 Jun;53(6):1669-77. doi: 10.1007/s10620-007-0026-8. Dig Dis Sci. 2008. PMID: 17932761 Review.
Cited by
-
European guidelines on chronic mesenteric ischaemia - joint United European Gastroenterology, European Association for Gastroenterology, Endoscopy and Nutrition, European Society of Gastrointestinal and Abdominal Radiology, Netherlands Association of Hepatogastroenterologists, Hellenic Society of Gastroenterology, Cardiovascular and Interventional Radiological Society of Europe, and Dutch Mesenteric Ischemia Study group clinical guidelines on the diagnosis and treatment of patients with chronic mesenteric ischaemia.United European Gastroenterol J. 2020 May;8(4):371-395. doi: 10.1177/2050640620916681. Epub 2020 Apr 16. United European Gastroenterol J. 2020. PMID: 32297566 Free PMC article.
-
Scanning and Actuation Techniques for Cantilever-Based Fiber Optic Endoscopic Scanners-A Review.Sensors (Basel). 2021 Jan 2;21(1):251. doi: 10.3390/s21010251. Sensors (Basel). 2021. PMID: 33401728 Free PMC article. Review.
-
Evaluation of visible diffuse reflectance spectroscopy in liver tissue: validation of tissue saturations using extracorporeal circulation.J Biomed Opt. 2021 May;26(5):055002. doi: 10.1117/1.JBO.26.5.055002. J Biomed Opt. 2021. PMID: 34021537 Free PMC article.
References
-
- Writing C, Bjorck M, Koelemay M, Acosta S, Bastos Goncalves F, Kolbel T, et al. Editor’s choice—management of the diseases of mesenteric arteries and veins: clinical practice guidelines of the european society of vascular surgery (ESVS) Eur J Vasc Endovasc Surg. 2017;53(4):460–510. doi: 10.1016/j.ejvs.2017.01.010. - DOI - PubMed
MeSH terms
Substances
LinkOut - more resources
Full Text Sources
Medical

