Present and future Köppen-Geiger climate classification maps at 1-km resolution
- PMID: 30375988
- PMCID: PMC6207062
- DOI: 10.1038/sdata.2018.214
Present and future Köppen-Geiger climate classification maps at 1-km resolution
Erratum in
-
Publisher Correction: Present and future Köppen-Geiger climate classification maps at 1-km resolution.Sci Data. 2020 Aug 17;7(1):274. doi: 10.1038/s41597-020-00616-w. Sci Data. 2020. PMID: 32807783 Free PMC article.
Abstract
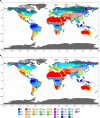
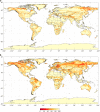
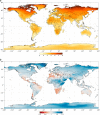
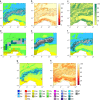
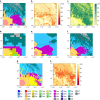
We present new global maps of the Köppen-Geiger climate classification at an unprecedented 1-km resolution for the present-day (1980-2016) and for projected future conditions (2071-2100) under climate change. The present-day map is derived from an ensemble of four high-resolution, topographically-corrected climatic maps. The future map is derived from an ensemble of 32 climate model projections (scenario RCP8.5), by superimposing the projected climate change anomaly on the baseline high-resolution climatic maps. For both time periods we calculate confidence levels from the ensemble spread, providing valuable indications of the reliability of the classifications. The new maps exhibit a higher classification accuracy and substantially more detail than previous maps, particularly in regions with sharp spatial or elevation gradients. We anticipate the new maps will be useful for numerous applications, including species and vegetation distribution modeling. The new maps including the associated confidence maps are freely available via www.gloh2o.org/koppen.
Conflict of interest statement
The authors declare no competing interests.
Figures
Similar articles
-
High-resolution (1 km) Köppen-Geiger maps for 1901-2099 based on constrained CMIP6 projections.Sci Data. 2023 Oct 23;10(1):724. doi: 10.1038/s41597-023-02549-6. Sci Data. 2023. PMID: 37872197 Free PMC article.
-
Publisher Correction: Present and future Köppen-Geiger climate classification maps at 1-km resolution.Sci Data. 2020 Aug 17;7(1):274. doi: 10.1038/s41597-020-00616-w. Sci Data. 2020. PMID: 32807783 Free PMC article.
-
Delineation of high resolution climate regions over the Korean Peninsula using machine learning approaches.PLoS One. 2019 Oct 10;14(10):e0223362. doi: 10.1371/journal.pone.0223362. eCollection 2019. PLoS One. 2019. PMID: 31600268 Free PMC article.
-
Designing ecological climate change impact assessments to reflect key climatic drivers.Glob Chang Biol. 2017 Jul;23(7):2537-2553. doi: 10.1111/gcb.13653. Epub 2017 Mar 6. Glob Chang Biol. 2017. PMID: 28173628 Review.
-
Public health air pollution impacts of pathway options to meet the 2050 UK Climate Change Act target: a modelling study.Southampton (UK): NIHR Journals Library; 2018 Jun. Southampton (UK): NIHR Journals Library; 2018 Jun. PMID: 29927565 Free Books & Documents. Review.
Cited by
-
Characteristics of river heatwaves in the Vistula River basin, Europe.Heliyon. 2024 Aug 13;10(16):e35987. doi: 10.1016/j.heliyon.2024.e35987. eCollection 2024 Aug 30. Heliyon. 2024. PMID: 39247302 Free PMC article.
-
Structural equation modeling to shed light on the controversial role of climate on the spread of SARS-CoV-2.Sci Rep. 2021 Apr 16;11(1):8358. doi: 10.1038/s41598-021-87113-1. Sci Rep. 2021. PMID: 33863938 Free PMC article.
-
Enhancing restoration success of rare plants in an arid-tropical climate through water-saving technologies: a case study of Scalesia affinis ssp. brachyloba in the Galapagos Islands.PeerJ. 2023 Dec 6;11:e16367. doi: 10.7717/peerj.16367. eCollection 2023. PeerJ. 2023. PMID: 38077418 Free PMC article.
-
Improving soil carbon estimates of Philippine mangroves using localized organic matter to organic carbon equations.Carbon Balance Manag. 2024 Sep 11;19(1):31. doi: 10.1186/s13021-024-00276-y. Carbon Balance Manag. 2024. PMID: 39259316 Free PMC article.
-
A conserved interdomain microbial network underpins cadaver decomposition despite environmental variables.Nat Microbiol. 2024 Mar;9(3):595-613. doi: 10.1038/s41564-023-01580-y. Epub 2024 Feb 12. Nat Microbiol. 2024. PMID: 38347104 Free PMC article.
References
Data Citations
-
- Beck H. E., et al. . 2018. Figshare. https://doi.org/10.6084/m9.figshare.6396959 - DOI
References
-
- Köppen W. Das geographische System der Klimate, 1–44 (Gebrüder Borntraeger: Berlin, Germany, 1936).
-
- Köppen W. Die Wärmezonen der Erde, nach der Dauer der heissen, gemässigten und kalten Zeit und nach der Wirkung der Wärme auf die organische Welt betrachtet. Meteorologische Zeitschrift 1, 215–226 (1884).
-
- Rubel F. & Kottek M. Comments on: “the thermal zones of the Earth” by Wladimir Köppen. (1884). Meteorologische Zeitschrift 20, 361–365 (2011).
-
- Webber B. L. et al. Modelling horses for novel climate courses: insights from projecting potential distributions of native and alien Australian acacias with correlative and mechanistic models. Diversity and Distributions 17, 978–1000 (2011).
-
- Mahlstein I., Daniel J. S. & Solomon S. Pace of shifts in climate regions increases with global temperature. Nature Climate Change 3, 739–743 (2013).
Publication types
Associated data
LinkOut - more resources
Full Text Sources

