Passive Reflectance Sensing and Digital Image Analysis Allows for Assessing the Biomass and Nitrogen Status of Wheat in Early and Late Tillering Stages
- PMID: 30364047
- PMCID: PMC6191577
- DOI: 10.3389/fpls.2018.01478
Passive Reflectance Sensing and Digital Image Analysis Allows for Assessing the Biomass and Nitrogen Status of Wheat in Early and Late Tillering Stages
Erratum in
-
Corrigendum: Passive Reflectance Sensing and Digital Image Analysis Allows for Assessing the Biomass and Nitrogen Status of Wheat in Early and Late Tillering Stages.Front Plant Sci. 2021 Apr 20;12:670027. doi: 10.3389/fpls.2021.670027. eCollection 2021. Front Plant Sci. 2021. PMID: 33959144 Free PMC article.
Abstract
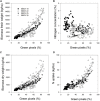
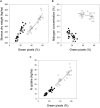
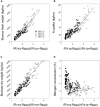
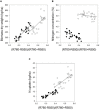
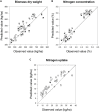
Proximal remote sensing systems depending on spectral reflectance measurements and image analysis can acquire timely information to make real-time management decisions compared to laborious destructive measurements. There is a need to make nitrogen management decisions at early development stages of cereals when the first top-dressing is made. However, there is insufficient information available about the possibility of detecting differences in the biomass or the nitrogen status of cereals at early development stages and even less comparing its relationship to destructively obtained information. The performance of hyperspectral passive reflectance sensing and digital image analysis was tested in a 2-year study to assess the nitrogen uptake and nitrogen concentration, as well as the biomass fresh and dry weight at early and late tillering stages of wheat from BBCH 19 to 30. Wheat plants were subjected to different levels of nitrogen fertilizer applications and differences in biomass, and the nitrogen status was further created by varying the seeding rate. To analyze the spectral and digital imaging data simple linear regression and partial least squares regression (PLSR) models were used. The green pixel digital analysis, spectral reflectance indices and PLSR of spectral reflectance from 400 to 1000 nm were strongly related to the nitrogen uptake and the biomass fresh and dry weights at individual measurements and for the combined dataset at the early crop development stages. Relationships between green pixels, spectral reflectance indices and PLSR with the biomass and nitrogen status parameters reached coefficients of determination up to 0.95∗∗ through the individual measurements and the combined data set. Reflectance-based spectral sensing compared to digital image analysis allows detecting differences in the biomass and nitrogen status already at early growth stages in the tillering phase. Spectral reflectance indices are probably more robust and can more easily be applied compared to PLSR models. This might pave the way for more informed management decisions and potentially lead to improved nitrogen fertilizer management at early development stages.
Keywords: digital agriculture; high-throughput sensing; imaging; nitrogen management; phenomics; precision farming; precision phenotyping; spectrometry.
Figures

Similar articles
-
Corrigendum: Passive Reflectance Sensing and Digital Image Analysis Allows for Assessing the Biomass and Nitrogen Status of Wheat in Early and Late Tillering Stages.Front Plant Sci. 2021 Apr 20;12:670027. doi: 10.3389/fpls.2021.670027. eCollection 2021. Front Plant Sci. 2021. PMID: 33959144 Free PMC article.
-
Evaluating RGB Imaging and Multispectral Active and Hyperspectral Passive Sensing for Assessing Early Plant Vigor in Winter Wheat.Sensors (Basel). 2018 Sep 3;18(9):2931. doi: 10.3390/s18092931. Sensors (Basel). 2018. PMID: 30177669 Free PMC article.
-
Comparative Performance of Spectral Reflectance Indices and Multivariate Modeling for Assessing Agronomic Parameters in Advanced Spring Wheat Lines Under Two Contrasting Irrigation Regimes.Front Plant Sci. 2019 Nov 28;10:1537. doi: 10.3389/fpls.2019.01537. eCollection 2019. Front Plant Sci. 2019. PMID: 31850029 Free PMC article.
-
Using Hand-Held Chlorophyll Meters and Canopy Reflectance Sensors for Fertilizer Nitrogen Management in Cereals in Small Farms in Developing Countries.Sensors (Basel). 2020 Feb 19;20(4):1127. doi: 10.3390/s20041127. Sensors (Basel). 2020. PMID: 32092989 Free PMC article. Review.
-
UV reflectance in crop remote sensing: Assessing the current state of knowledge and extending research with strawberry cultivars.PLoS One. 2024 Mar 25;19(3):e0285912. doi: 10.1371/journal.pone.0285912. eCollection 2024. PLoS One. 2024. PMID: 38527020 Free PMC article. Review.
Cited by
-
Estimation of wheat tiller density using remote sensing data and machine learning methods.Front Plant Sci. 2022 Dec 21;13:1075856. doi: 10.3389/fpls.2022.1075856. eCollection 2022. Front Plant Sci. 2022. PMID: 36618628 Free PMC article.
-
Winter Wheat Nitrogen Estimation Based on Ground-Level and UAV-Mounted Sensors.Sensors (Basel). 2022 Jan 11;22(2):549. doi: 10.3390/s22020549. Sensors (Basel). 2022. PMID: 35062509 Free PMC article.
-
Integration of Radiometric Ground-Based Data and High-Resolution QuickBird Imagery with Multivariate Modeling to Estimate Maize Traits in the Nile Delta of Egypt.Sensors (Basel). 2021 Jun 6;21(11):3915. doi: 10.3390/s21113915. Sensors (Basel). 2021. PMID: 34204099 Free PMC article.
-
How does nitrogen shape plant architecture?J Exp Bot. 2020 Jul 25;71(15):4415-4427. doi: 10.1093/jxb/eraa187. J Exp Bot. 2020. PMID: 32279073 Free PMC article. Review.
-
In-Field Wheat Reflectance: How to Reach the Organ Scale?Sensors (Basel). 2022 Apr 27;22(9):3342. doi: 10.3390/s22093342. Sensors (Basel). 2022. PMID: 35591041 Free PMC article.
References
-
- Adamsen F. G., Pinter J. P., Barnes M. E., LaMorte L. R., Wall W. G., Leavitt W. S., et al. (1999). Measuring wheat senescence with a digital camera. Crop Sci. 39 719–724. 10.2135/cropsci1999.0011183X003900030019x - DOI
-
- Baresel J. P., Rischbeck P., Hu Y., Kipp S., Hu Y., Barmeier G., et al. (2017). Use of a digital camera as alternative method for non-destructive detection of the leaf chlorophyll content and the nitrogen nutrition status in wheat. 2017. Comput. Electron. Agric. 140 25–33. 10.1016/j.compag.2017.05.032 - DOI
-
- Barnes E. M., Clarke T. R., Richards S. E., Colaizzi P. D., Haberland J., Kostrzewski M. (2000). “Coincident detection of crop water stress, nitrogen status and canopy density using ground-based multispectral data,” in Proceedings of the 5th International Conference on Precision Agriculture, Bloomington, MN.
LinkOut - more resources
Full Text Sources

