The NFκB subunit RELA is a master transcriptional regulator of the committed epithelial-mesenchymal transition in airway epithelial cells - PubMed Skip to main page content
U.S. flag

An official website of the United States government

Dot gov

The .gov means it’s official.
Federal government websites often end in .gov or .mil. Before sharing sensitive information, make sure you’re on a federal government site.

Https

The site is secure.
The https:// ensures that you are connecting to the official website and that any information you provide is encrypted and transmitted securely.

Access keys NCBI Homepage MyNCBI Homepage Main Content Main Navigation
. 2018 Oct 19;293(42):16528-16545.
doi: 10.1074/jbc.RA118.003662. Epub 2018 Aug 30.

The NFκB subunit RELA is a master transcriptional regulator of the committed epithelial-mesenchymal transition in airway epithelial cells

Affiliations

The NFκB subunit RELA is a master transcriptional regulator of the committed epithelial-mesenchymal transition in airway epithelial cells

Bing Tian et al. J Biol Chem. .

Abstract

The epithelial-mesenchymal transition (EMT) is a multistep dedifferentiation program important in tissue repair. Here, we examined the role of the transcriptional regulator NF-κB in EMT of primary human small airway epithelial cells (hSAECs). Surprisingly, transforming growth factor β (TGFβ) activated NF-κB/RELA proto-oncogene, NF-κB subunit (RELA) translocation within 1 day of stimulation, yet induction of its downstream gene regulatory network occurred only after 3 days. A time course of TGFβ-induced EMT transition was analyzed by RNA-Seq in the absence or presence of inducible shRNA-mediated silencing of RELA. In WT cells, TGFβ stimulation significantly affected the expression of 2,441 genes. Gene set enrichment analysis identified WNT, cadherin, and NF-κB signaling as the most prominent TGFβ-inducible pathways. By comparison, RELA controlled expression of 3,138 overlapping genes mapping to WNT, cadherin, and chemokine signaling pathways. Conducting upstream regulator analysis, we found that RELA controls six clusters of upstream transcription factors, many of which overlapped with a transcription factor topology map of EMT developed earlier. RELA triggered expression of three key EMT pathways: 1) the WNT/β-catenin morphogen pathway, 2) the JUN transcription factor, and 3) the Snail family transcriptional repressor 1 (SNAI1). RELA binding to target genes was confirmed by ChIP. Experiments independently validating WNT dependence on RELA were performed by silencing RELA via genome editing and indicated that TGFβ-induced WNT5B expression and downstream activation of the WNT target AXIN2 are RELA-dependent. We conclude that RELA is a master transcriptional regulator of EMT upstream of WNT morphogen, JUN, SNAI1-ZEB1, and interleukin-6 autocrine loops.

Keywords: NF-κB; RELA proto-oncogene; Wnt; ZEB; epithelial-mesenchymal transition (EMT); gene regulation; lung disease; mucosal injury; transcription regulation; transforming growth factor β (TGF-β).


Conflict of interest statement

The authors declare that they have no conflicts of interest with the contents of this article

Figures
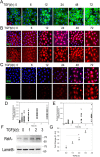
Figure 1.
Figure 1.
Kinetics of RELA translocation and activating phosphorylation. hSAECs were stimulated with TGFβ (10 ng/ml) for the indicated times (in hours). Untreated cells were negative controls (time 0). A, cells were fixed and stained with Alexa Fluor 488–phalloidin (green). Nuclei were counterstained with DAPI (blue) and imaged by CFM at 63× magnification. B, hSAECs were stained with rabbit anti-RELA Ab, and secondary detection was performed with Alexa Fluor 568–labeled goat anti-rabbit IgG (red). Nuclei were DAPI-counterstained and imaged by CFM. Top panel, Alexa Fluor 568 and DAPI merged image; bottom panel, Alexa Fluor 568 staining only. C, CFM for phospho-Ser-276 RELA. Top panel, Alexa Fluor 568 and DAPI merged image; bottom panel, Alexa Fluor 568 staining only. D and E, quantification of nuclear fluorescence intensity. Shown are scatter plots and median nuclear fluorescence intensities for RELA and phospho-Ser-276 RELA, respectively, for individual cell quantifications using ImageJ. AU, absorbance units. F, Western immunoblot for 65-kDa RELA (top). Lamin B was stained as a loading control (bottom). d, days. G, quantification of normalized fluorescence intensity of RELA signal. *, p < 0.05 (ANOVA, post hoc Tukey's test).
Figure 2.
Figure 2.
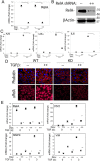
Characterization of RELA silencing by Dox-induced shRNA. A, effect on RELA expression. hSAECs stably expressing TRIPZ Tet-On inducible lentiviral RELA shRNA were isolated. Cells were untreated (−) or treated with Dox (2 μg/ml, 5 days) prior to TNF stimulation (20 ng/ml, 1 h). Shown are individual RELA mRNA abundance measurements in n = 3 samples expressed as -fold change relative to untreated cells. **, p < 0.01, ANOVA, post hoc Tukey's test. B, effect on RELA protein abundance. Shown is a Western immunoblot of untreated (−) or Dox-treated (2 μg/ml, 5 days) whole-cell lysates. Top panel, anti-RELA Ab; bottom panel, β-actin probed as a protein loading control. C, Q-RT-PCR for TNFAIP3/A20, NFKBIA/IκBα, and IL6 mRNA. Individual mRNA abundance in separate replicates normalized to POLB. *, p < 0.05; **, p < 0.01, ANOVA, post hoc Tukey's test. D, WT or RELA KD hSAECs were stimulated with TGFβ for 0, 1, or 3 days, respectively; cells were fixed, stained with Alexa Fluor 568–conjugated phalloidin (for distribution of F-actin, shown in red color, upper panel) or with primary rabbit anti-RELA antibody followed by staining with Alexa Fluor 568–conjugated anti-rabbit IgG (lower panel) as well as DAPI (in blue color); and examined by CFM. E, Q-RT-PCR was performed for RELA and mesenchymal signature genes FN1, MMP9, and VIM as indicated. Shown is individual replicate mRNA abundance normalized to β-polymerase relative to unstimulated cells. d, days. *, p < 0.05; **, p < 0.01, ANOVA, post hoc Tukey's test.
Figure 3.
Figure 3.
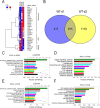
Analysis of the TGFβ-induced gene regulatory network. A, behavior of EMT signature genes in WT cells. Expression patterns of 23 signature epithelial or mesenchymal genes in the WT cell time course were z-score–normalized and subjected to hierarchical clustering using Euclidian distance. Three major clusters, epithelial, pEMT, and mesenchymal genes, were identified. B, overlap of differentially expressed genes after 1 and 3 days of TGFβ stimulation. Genes with 4-fold change in transcripts per million and adjusted p value of <0.01 were compared. C and E, GSEA showing hallmark gene sets enriched in differentially expressed genes in WT cells for 1 and 3 days (d) after stimulation, respectively. For each gene set, the fraction of genes represented in the pathway and the significance are plotted (p value). FDR, false discovery rate. D and F, pathway enrichment analysis. Shown are the top 10 overrepresented pathways for the differentially expressed genes in WT cells for 1 and 3 days after stimulation as indicated. FGF, fibroblast growth factor; CCKR, cholecystokinin receptor; GHRH, growth hormone-releasing hormone.
Figure 4.
Figure 4.
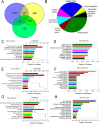
Analysis of the RELA-dependent GRN. A, Venn diagram showing overlap of differentially expressed genes in RELA KD cells after 1 and 3 days of TGFβ stimulation. NF-κB–dependent genes are defined as those with 4-fold change between KD and WT cells, p < 0.01 compared for each treatment time. B, overrepresentation of the GO molecular functions for all unique genes in the RELA-dependent GRN. Note that the major GO term is transcription factor activity. C, E, and G, GSEA for RELA-dependent genes in control (day 0 (d0)) and 1 and 3 days after stimulation. D, F, and H, pathway enrichment analysis. Shown are the top 10 overrepresented pathways for the differentially expressed genes in RELA KD cells in control (day 0) and at 1 and 3 days as indicated. CCKR, cholecystokinin receptor; GHRH, growth hormone-releasing hormone; EGFR, epidermal growth factor receptor; PDGF, platelet-derived growth factor; ACHR, acetylcholine receptor; FDR, false discovery rate.
Figure 5.
Figure 5.
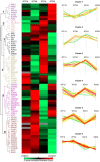
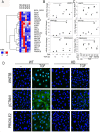
Upstream regulator analysis of NF-κB–dependent transcription factors in EMT. Upstream regulator analysis was performed on the differentially regulated genes identified in WT (1 or 3 days (d)) versus unstimulated cells and RELA KD (1 or 3 days) versus unstimulated RELA KD. Left, heat map of activation z-score of each transcription regulators. Red color, activation effect; green, inhibitory effect. Right, plot of z-score for individual regulators. Note the dramatic inhibitory effects of regulators in Cluster 6 in the RELA KD, including JUN, SNAI1, and CTNNB1.
Figure 6.
Figure 6.
Effect of RELA KD on the WNT signaling pathway. A, hierarchical clustering of temporal expression of WNT pathway members. Mean transcripts per million counts for each experimental condition were z-score–normalized by row and subjected to hierarchical clustering using Euclidean distance. Gene names are given by universal gene symbol. B, Q-RT-PCR assay was independently conducted to confirm RNA-Seq expression profiles for WNT3, WNT5B, and PRICKLE2 mRNA. Shown are individual mRNA abundance in replicates normalized to POLB. *, p < 0.05; **, p < 0.01, ANOVA, post hoc Tukey's test. C, XChIP assay was conducted to quantify RELA binding to the proximal promoter. Stimulation (Stim) conditions are control, TGFβ, or TGFβ + TNF. Antibodies used are normal anti-rabbit IgG or anti-RELA. Q-gPCR was conducted using gene-specific primer pairs (Table S3) corrected for input (70). Data are expressed as -fold change relative to control WT cells immunoprecipitated with IgG. Shown are individual replicates. D, expression of WNT5B, CTNNB1, and PRICKLE2 was determined by CFM. Ab detection was by secondary Alexa Fluor 488 (green); nuclei are stained with DAPI (blue). CFM was taken at 63×. d, day.
Figure 7.
Figure 7.
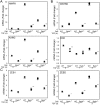
Validation of RELA dependence of WNT signaling using RELA silencing by CRISPR/Cas9. CRISPR/Cas9–mediated genome editing was used to create a constitutive deletion of RELA in hSAECs. WT or RELA−/− cells were stimulated with TGFβ (10 ng/ml) for 0, 1, or 3 days (d) as indicated. Shown are -fold change mRNA in separate replicates normalized to POLB for MMP9, WNT5B, AXIN2, DKK, and ZEB1/2. *, p < 0.05; **, p < 0.01, ANOVA, post hoc Tukey's test.
Figure 8.
Figure 8.
NF-κB/RELA is upstream of master transcription factors SNAI1 and JUN. A and C, Q-RT-PCR assay profile for SNAI1 and JUN, respectively. WT or RELA KD was cultured in the absence or presence of TGFβ stimulation (Stim) for 1 and 3 days (d). Shown is -fold change mRNA for individual replicates normalized to POLB. B and D, XChIP assay of RELA binding to the proximal promoter of SNAI1 and JUN, respectively. Q-gPCR was conducted using gene-specific primer pairs (Table S3) corrected for input (70). *, p < 0.05; **, p < 0.01, ANOVA, post hoc Tukey's test.

Similar articles

Cited by

References

    1. Knight D. A., and Holgate S. T. (2003) The airway epithelium: structural and functional properties in health and disease. Respirology 8, 432–446 10.1046/j.1440-1843.2003.00493.x - DOI - PubMed
    1. Lambrecht B. N., and Hammad H. (2012) The airway epithelium in asthma. Nat. Med. 18, 684–692 10.1038/nm.2737 - DOI - PubMed
    1. Kalluri R., and Weinberg R. A. (2009) The basics of epithelial-mesenchymal transition. J. Clin. Investig. 119, 1420–1428 10.1172/JCI39104 - DOI - PMC - PubMed
    1. Jordan N. V., Johnson G. L., and Abell A. N. (2011) Tracking the intermediate stages of epithelial-mesenchymal transition in epithelial stem cells and cancer. Cell Cycle 10, 2865–2873 10.4161/cc.10.17.17188 - DOI - PMC - PubMed
    1. Katsuno Y., Lamouille S., and Derynck R. (2013) TGF-β signaling and epithelial-mesenchymal transition in cancer progression. Curr. Opin. Oncol. 25, 76–84 10.1097/CCO.0b013e32835b6371 - DOI - PubMed

Publication types