A low-complexity metabolic network model for the respiratory and fermentative metabolism of Escherichia coli - PubMed Skip to main page content
U.S. flag

An official website of the United States government

Dot gov

The .gov means it’s official.
Federal government websites often end in .gov or .mil. Before sharing sensitive information, make sure you’re on a federal government site.

Https

The site is secure.
The https:// ensures that you are connecting to the official website and that any information you provide is encrypted and transmitted securely.

Access keys NCBI Homepage MyNCBI Homepage Main Content Main Navigation
. 2018 Aug 29;13(8):e0202565.
doi: 10.1371/journal.pone.0202565. eCollection 2018.

A low-complexity metabolic network model for the respiratory and fermentative metabolism of Escherichia coli

Affiliations

A low-complexity metabolic network model for the respiratory and fermentative metabolism of Escherichia coli

Ignace L M M Tack et al. PLoS One. .

Abstract

Over the last decades, predictive microbiology has made significant advances in the mathematical description of microbial spoiler and pathogen dynamics in or on food products. Recently, the focus of predictive microbiology has shifted from a (semi-)empirical population-level approach towards mechanistic models including information about the intracellular metabolism in order to increase model accuracy and genericness. However, incorporation of this subpopulation-level information increases model complexity and, consequently, the required run time to simulate microbial cell and population dynamics. In this paper, results of metabolic flux balance analyses (FBA) with a genome-scale model are used to calibrate a low-complexity linear model describing the microbial growth and metabolite secretion rates of Escherichia coli as a function of the nutrient and oxygen uptake rate. Hence, the required information about the cellular metabolism (i.e., biomass growth and secretion of cell products) is selected and included in the linear model without incorporating the complete intracellular reaction network. However, the applied FBAs are only representative for microbial dynamics under specific extracellular conditions, viz., a neutral medium without weak acids at a temperature of 37℃. Deviations from these reference conditions lead to metabolic shifts and adjustments of the cellular nutrient uptake or maintenance requirements. This metabolic dependency on extracellular conditions has been taken into account in our low-complex metabolic model. In this way, a novel approach is developed to take the synergistic effects of temperature, pH, and undissociated acids on the cell metabolism into account. Consequently, the developed model is deployable as a tool to describe, predict and control E. coli dynamics in and on food products under various combinations of environmental conditions. To emphasize this point,three specific scenarios are elaborated: (i) aerobic respiration without production of weak acid extracellular metabolites, (ii) anaerobic fermentation with secretion of mixed acid fermentation products into the food environment, and (iii) respiro-fermentative metabolic regimes in between the behaviors at aerobic and anaerobic conditions.


Conflict of interest statement

The authors have declared that no competing interests exist.

Figures
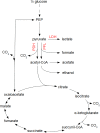
Fig 1
Fig 1. Central metabolic pathways of E. coli.
Glucose is converted to phosphoenolpyruvate (PEP) and pyruvate through the glycolysis pathway, indicated by the dashed line. Subsequently, under oxygen-rich conditions, pyruvate is converted to acetyl-CoA through the pyruvate dehydrogenase (PDH) enzyme complex, whereupon acetyl-CoA enters the tricarboxylic acid cycle (TCA) as citrate. Under oxygen-limited conditions, pyruvate reacts to lactic acid through the lactate dehydrogenase (LDH) pathway or to formic acid and acetyl-CoA by means of the pyruvate formate lyase (PFL) complex. In the absence of a functional TCA cycle at oxygen limitations, acetyl-CoA is transformed to acetic acid or ethanol.
Fig 2
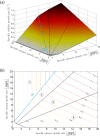
Fig 2. Phenotypic phase plane analysis, after [34]: Specific cellular growth rate as a function of specific glucose and oxygen uptake rates with maximization of biomass growth as cellular objective, presented as (a) 3D plot and (b) contour plot.
The phenotypic phase plane consists of four phases, each representing a different metabolic regime. In Sector 1 glucose is completely converted to CO2 through the tricarboxylic (TCA) cycle. The other sectors are characterized by the secretion of weak acid cell products in the cellular environment: acetic acid in Sector 2; acetic and formic acid in Sector 3; acetic acid, formic acid and ethanol in Sector 4. On the boundary between Sector 1 and 2, glucose is converted to biomass at a maximal observed yield. For this reason, this boundary is indicated as the line of optimality (LO). This figure has been reprinted from [34]. The original figure has been published under a CC BY license.
Fig 3
Fig 3. Specific growth rate as a function of specific glucose uptake rate under fully aerobic conditions.
The full line represents the results obtained by the PhPP analysis with the COBRA toolbox. These results are adapted to the linear mathematical structure of Pirt’s law, as indicated by the dashed line.
Fig 4
Fig 4. Specific microbial growth rate as a function of temperature according to Eqs (20) and (21).
Experimental data are taken from [47] (◊), [48] (▫), and [49] (∘). A rescaling factor of 0.382 is used to take into account that these data were obtained from experiments in BHI medium supporting higher specific growth rates than M9 media [37, 49].
Fig 5
Fig 5. Specific growth rate and metabolite secretion rates as a function of specific glucose uptake rate.
Full lines represent the FBA results with the iAF1260 model. Dashed lines illustrate the model of [23] fitted on the FBA output.
Fig 6
Fig 6. Anaerobic metabolism of E. coli.
From phosphoenolpyruvate (PEP) and pyruvate, metabolic products are formed in reactions catalyzed by lactate dehydrogenase (LDH), pyruvate formate lyase (PFL), phosphotransacetylase (PTA), acetate kinase (ACKA), alcohol dehydrogenase (ADH), and formate hydrogen lyase (FHL). The underlined metabolic products are secreted to the environment.
Fig 7
Fig 7. Fraction of decomposed formic acid α fit as a function of pH (MSSE = 0.0085).
Experimental data (∘) are taken from [53], [59], and [61].
Fig 8
Fig 8. Specific growth rate and lactic acid secretion rate at the homolactic metabolic regime.
Full lines are obtained from FBA with the iAF1260 model in which the PFL reaction is eliminated. The FBA results are fitted by the linear model of [23], as represented by the dashed lines.
Fig 9
Fig 9. Lactic acid yield coefficient YL/S fitted as a sigmoid function of pH (MSSE = 0.0022).
Experimental data (∘) are taken from [58]. The maximum lactic acid yield YL/S,maxLDH in the homolactic LDH metabolic regime at low pH values is determined by means of an FBA analysis with the iAF1260 metabolic model [32] in the COBRA toolbox for MATLAB [33].
Fig 10
Fig 10. Specific growth rate as a function of specific glucose uptake rate at a constant specific oxygen uptake rate of 5 mmol/(gDW.h).
The function exhibits a piecewise linear behavior in which each of the linear phases corresponds to one of the metabolic regimes (Sectors 1,2,3 and 4 in the PhPP in Fig 2).
Fig 11
Fig 11. The influence of extracellular pH on the maintenance coefficient as a function of the specific oxygen uptake rate.
Fig 12
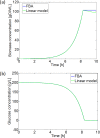
Fig 12. Simulation results of the aerobic batch experiment in Eqs (37) and (38) with FBA and the developed linear model: (a) biomass growth, and (b) glucose consumption.
In Subfigure (a) the simulation with the FBA model does not exhibit declines in the biomass concentration, as the FBA with the COBRA toolbox is not capable to predict negative specific growth rates.
Fig 13
Fig 13. Interaction between cardinal parameters.
(a) Maximum growth temperature Tmax as a function of pH and undissociated acid concentrations; (b) pHmin as a function of temperature and undissociated acid concentrations; (c) Minimum inhibitory concentration of acetate [UA]min as a function of temperature, pH, and formate and lactate concentrations; (d) Minimum inhibitory concentration of formate [UF]min as a function of temperature, pH, and acetate and lactate concentrations; (e) Minimum inhibitory concentration of lactate [UL]min as a function of temperature, pH, and formate and lactate concentrations.

Similar articles

Cited by

References

    1. EFSA (European Food Safety Authority), ECDC (European Centre for Disease Prevention and Control). The European Union summary report on trends and sources of zoonoses, zoonotic agents and food-borne outbreaks in 2012. EFSA Journal. 2014;12(2):312. - PMC - PubMed
    1. Sánchez A, Bennett G, San KY. Novel pathway engineering design of the anaerobic central metabolic pathway in Escherichia coli to increase succinate yield and productivity. Metab Eng. 2005;7(3):229–239. 10.1016/j.ymben.2005.03.001 - DOI - PubMed
    1. Dharmadi Y, Murarka A, Gonzalez R. Anaerobic fermentation of glycerol by Escherichia coli: A new platform for metabolic engineering. Biotechnol Bioeng. 2006;94(5):821–829. 10.1002/bit.21025 - DOI - PubMed
    1. Yazdani S, Gonzalez R. Engineering Escherichia coli for the efficient conversion of glycerol to ethanol and co-products. Metab Eng. 2008;10(6):340–351. 10.1016/j.ymben.2008.08.005 - DOI - PubMed
    1. Trinh C, Srienc F. Metabolic engineering of Escherichia coli for efficient conversion of glycerol to ethanol. 2009. 2009;75(21):6696–6705. - PMC - PubMed

Publication types

Grants and funding

The research of I.L.M.M. Tack is funded by PhD grant IWT SB-111565 of the Agency for Innovation by Science and Technology (IWT, https://www.vlaio.be/nl). In addition, this work is supported by projects FWO-G.0930.13 and FWO KAN2013,1.5.189.13 of the Research Foundation - Flanders (FWO, https://www.vlaio.be/nl), project PFV/10/002 (Center of Excellence OPTEC - Optimization in Engineering) of the KU Leuven Research Fund (https://www.kuleuven.be/english/research/support/if), Knowledge Platform KP/09/005 (SCORES4CHEM) of the KU Leuven Industrial Research Fund (https://www.kuleuven.be/english/research/iof), and the Belgian Program on Interuniversity Poles of Attraction, initiated by the Belgian Federal Science Policy Office (IAP Phase VII - 19 DYSCO, https://www.belspo.be).

LinkOut - more resources