Genomewide binding of transcription factor Snail1 in triple-negative breast cancer cells - PubMed Skip to main page content
U.S. flag

An official website of the United States government

Dot gov

The .gov means it’s official.
Federal government websites often end in .gov or .mil. Before sharing sensitive information, make sure you’re on a federal government site.

Https

The site is secure.
The https:// ensures that you are connecting to the official website and that any information you provide is encrypted and transmitted securely.

Access keys NCBI Homepage MyNCBI Homepage Main Content Main Navigation
. 2018 Jun;12(7):1153-1174.
doi: 10.1002/1878-0261.12317. Epub 2018 May 21.

Genomewide binding of transcription factor Snail1 in triple-negative breast cancer cells

Affiliations

Genomewide binding of transcription factor Snail1 in triple-negative breast cancer cells

Varun Maturi et al. Mol Oncol. 2018 Jun.

Abstract

Transcriptional regulation mediated by the zinc finger protein Snail1 controls early embryogenesis. By binding to the epithelial tumor suppressor CDH1 gene, Snail1 initiates the epithelial-mesenchymal transition (EMT). The EMT generates stem-like cells and promotes invasiveness during cancer progression. Accordingly, Snail1 mRNA and protein is abundantly expressed in triple-negative breast cancers with enhanced metastatic potential and phenotypic signs of the EMT. Such high endogenous Snail1 protein levels permit quantitative chromatin immunoprecipitation-sequencing (ChIP-seq) analysis. Snail1 associated with 185 genes at cis regulatory regions in the Hs578T triple-negative breast cancer cell model. These genes include morphogenetic regulators and signaling components that control polarized differentiation. Using the CRISPR/Cas9 system in Hs578T cells, a double deletion of 10 bp each was engineered into the first exon and into the second exon-intron junction of Snail1, suppressing Snail1 expression and causing misregulation of several hundred genes. Specific attention to regulators of chromatin organization provides a possible link to new phenotypes uncovered by the Snail1 loss-of-function mutation. On the other hand, genetic inactivation of Snail1 was not sufficient to establish a full epithelial transition to these tumor cells. Thus, Snail1 contributes to the malignant phenotype of breast cancer cells via diverse new mechanisms.

Keywords: bone morphogenetic protein; breast cancer; chromatin immunoprecipitation; epithelial-mesenchymal transition; transforming growth factor β.


Figures

Figure 1
Figure 1
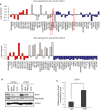
Hs578T breast cancer cells express high Snail1 levels. (A) Expression of SNAIL1 and Slug/SNAIL2 mRNA in different subtypes of breast cancers cell lines (basal‐A, red; basal‐B, gray; and luminal, blue) based on expression values derived from the GOBO database. (B) Immunoblot analysis showing protein expression of Snail1, Slug, and loading control β‐actin in Hs578T, MDAMB‐231, and T47D cells stimulated with vehicle (control) or TGFβ (5 ng·mL−1) for 9 h. (C) ChIPqPCR showing the significant enrichment (0.1% of the total input) of the CDH1 promoter region in a ChIP experiment using the Snail1 antibody, relative to the enrichment by nonspecific IgG. Statistical significance *P‐value = 0.037 is shown based on a Student's t‐test where n = 3, and average values along with SD are shown.
Figure 2
Figure 2
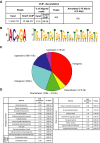
Snail1 associates with hundreds of genomic sites in triple‐negative breast cancer cells. (A) Table showing data and flow of analysis of a Snail1 ChIP‐seq experiment from sequence reads to annotated gene assignment of the Snail1 binding sites. (B) Visualization of statistically significant DNA motifs, derived from the Snail1 binding site sequences in Hs578T cells using the TOMTOM motif comparison tool. The sequence on the left is not, whereas the sequence to the right is centrally enriched. Sequence position is graphed on the x‐axis versus probability of frequency (bits) on the y‐axis. (C) Pie chart showing the relative location of Snail1 binding peaks on the Hg19 genome with respect to annotated genes. (D) GO analysis of annotated genes from the Snail1 ChIP‐seq peaks into molecular function, biological process and cellular component categories using the GO Panther database. Relative fold enrichment and P‐values indicate significance of each functional category.
Figure 3
Figure 3
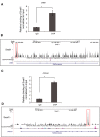
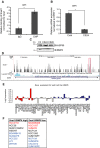
Novel gene targets of Snail1 in breast cancer cells. (A, C) ChIPqPCR showing the significant enrichment of the CRB1 (0.02% of the total input) (A) and PPFIA1 (0.05% of the total input) (C) promoter regions in a ChIP experiment using the Snail1 antibody, relative to the enrichment by nonspecific IgG. Statistical significance *P‐value = 8.76E‐04 and P‐value = 2.37E‐05, respectively, is shown based on a Student's t‐test where = 3, and average values along with SD are shown. (B, D) Representation of Snail1 binding to the CRB1 (B) and PPFIA1 (D) genes; ChIP‐seq peaks (marked in red box) were aligned with tracks of H3K27Ac ChIP‐seq, which is used as a marker of gene activity, based on data available on the database, using the UCSC genome browser.
Figure 4
Figure 4
Binding of Snail1 to newly identified DNA sequences. (A) Selected genes and DNA sequences from these genes where Snail1 binding peaks were identified by ChIP‐seq (which were synthesized as biotinylated oligonucleotides), and corresponding motifs included in each gene sequence. (B) Binding of Snail1 protein expressed in transfected HEK‐293T cells and analyzed by DNAP using the specific DNA oligonucleotides of panel A. Input shows total cell lysate from the same cells prior to application to the biotinylated oligonucleotides and beads show negative control of streptavidin beads plus cell lysate in the absence of DNA.
Figure 5
Figure 5
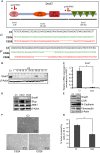
Snail1 knockout generates an intermediate phenotype and suppresses cell migration of Hs578T cells. (A) DNA sequences of the Snail1 gene in control C3 cells and deleted nucleotides in Snail1 knockout clones CS24 and CS26 after CRISPR‐/Cas9‐mediated knockout using specific gRNA‐containing plasmids (red arrows on the Snail1 gene cartoon). The latter graphs the human Snail1 protein with its functional domains, SNAG regulatory domain, serine‐rich domain (SRD), nuclear export signal (NES), and ZF, along with the corresponding three exons and numbering of the amino acid residues. (B) Immunoblot analysis showing Snail1 protein levels along with β‐actin levels that serve as protein loading control, in Hs578T cell clones C3 (control), Snail1 KO clones CS1, CS10, CS19, CS19 less protein, CS21, CS24, CS26, CS28, CS29, CS30, and CS31. (C) Quantification of Snail1 mRNA expression levels in C3 and CS24 clones. Statistical significance *P‐value = 0.0003 is shown based on a Student's t‐test where n = 3, and average values along with SD are shown. (D) Immunoblot analysis showing levels of Snail1, Slug, ZEB1, and β‐actin proteins in C3, CS24, and CS26 clones. (E) Protein analysis of Snail1, CAR, N‐cadherin, fibronectin, and β‐actin, in C3 and CS24 clones. (F) Phase contrast images showing cell morphology in C3, CS24, and CS26 Hs578T cell clones. Bars represent 50 μm. (F) Quantification of wound healing assays by the T‐scratch software, showing % of wound closure area 24 h after a scratch was made in C3 and CS24 Hs578T cell clones. Statistical significance *P‐value = 0.0007 is shown based on a Student's t‐test where n = 3, and average values along with SD are shown.
Figure 6
Figure 6
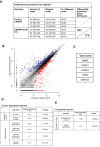
Transcriptomic analysis of genes regulated by Snail1. (A) Table showing data and flow of analysis using AmpliSeq transcriptomic arrays measuring gene expression in triplicate biological replicates of C3 (Control CRISPR) and CS24 (CRISPR Snail1 KO) Hs578T cell clones, from number of reads obtained to number of differentially expressed genes (upregulated: top sector, and downregulated: bottom sector). (B) Profile of all the Ref‐Seq genes based on their relative expression in the CS24 Hs578T cell clone plotted against the C3 Hs578T cell clone. Upregulated genes in the Snail1 knockout clone (blue) and downregulated genes (red color) along with statistically nonsignificant expressed genes (gray color) are plotted, and genes identified using the ChIP‐seq analysis (Fig. 1) are superimposed using a plus symbol. (C) List of the five genes that are marked with plus symbol in panel B. (D, E) GO analysis of annotated genes from the Snail1 knockout AmpliSeq experiment, classified into molecular function, biological process and cellular component categories using the GO panther database. Relative fold enrichment and P values indicate significance of gene classification in each functional category. The data are divided into (D) differentially expressed and significantly downregulated genes upon Snail1 knockout and (E) differentially expressed and significantly upregulated genes upon Snail1 knockout.
Figure 7
Figure 7
Snail1 regulates BMP6. (A) ChIPqPCR showing a significant enrichment (0.3% of the total input) of the BMP6 promoter region in a ChIP experiment using the Snail1 antibody, relative to the enrichment by nonspecific IgG. Statistical significance *P‐value = 0.0002 is shown based on a Student's t‐test where = 3, and average values along with SD are shown. (B) Measurement of relative amount of BMP6 mRNA expressed in C3 and CS24 Hs578T cells after normalization with the HPRT1 housekeeping mRNA. Statistical significance *P‐value = 1.32E‐06 is shown based on a Student's t‐test where = 3, and average values along with SD are shown. (C) Protein analysis of loading control HSP95 and mature monomeric BMP6 in C3, CS24, and CS26 clones. (D) Representation of Snail1 binding to the BMP6 gene; obtained ChIP‐seq peaks (marked in red box) and with tracks of H3K27Ac ChIP‐seq, which is used as a marker of enhancer activity, based on data available in the database, using the UCSC genome browser. (E) Expression of BMP6 mRNA in different subtypes of breast cancer cell lines (basal‐A, red; basal‐B, gray; and luminal, blue) based on expression values derived from the GOBO database. (F) The analysis of BMP6 mRNA expression using the GOBO database showed nine breast cancer cell lines with high SNAIL1 and high BMP6 expression and 10 with low SNAIL1 and low BMP6 expression. Each cell line is color‐coded according to their division in basal‐A, red; basal‐B, black; and luminal, blue.
Figure 8
Figure 8
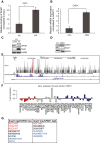
CPED1 is a novel target gene of Snail1. (A) ChIPqPCR showing a significant enrichment (0.2% of the total input) of the CPED1 promoter region in a ChIP experiment using the Snail1 antibody, relative to the enrichment by nonspecific IgG. Statistical significance *P‐value = 0.0015 is shown based on a Student's t‐test where n = 3, and average values along with SD are shown. (B) Measurement of relative amount of CPED1 mRNA expressed in C3 and CS24 Hs578T cells after normalization with the HPRT1 housekeeping mRNA. Statistical significance *P‐value = 0.0002 is shown based on a Student's t‐test where n = 3, and average values along with SD are shown. (C) Protein analysis of CPED1, Snail1, and HSP95 in C3 clones transfected with pcDNA3 empty vector and HA‐Snail1 plasmid. (D) Protein analysis of CPED1, Snail1, and HSP95 in C3 and CS24 clones. (E) Representation of Snail1 binding to the CPED1 gene; obtained ChIP‐seq peaks (marked in red box) and with tracks of H3K27Ac ChIP‐seq, which is used as a marker of enhancer activity, based on data available in the UCSC genome browser. (F) Expression of CPED1 mRNA in different subtypes of breast cancers cell lines (basal‐A, red; basal‐B, gray; and luminal, blue) based on expression values derived from the GOBO database. (G) The analysis of CPED1 mRNA expression using the GOBO database showed eight breast cancer cell lines with high SNAIL1 and low CPED1 expression and six with low SNAIL1 and high CPED1 expression. Each cell line is color‐coded according to their division in basal‐A, red; basal‐B, black; and luminal, blue.

Similar articles

Cited by

References

    1. Astro V, Asperti C, Cangi MG, Doglioni C and de Curtis I (2011) Liprin‐a1 regulates breast cancer cell invasion by affecting cell motility, invadopodia and extracellular matrix degradation. Oncogene 30, 1841–1849. - PubMed
    1. Bachelder RE, Yoon SO, Franci C, de Herreros AG and Mercurio AM (2005) Glycogen synthase kinase‐3 is an endogenous inhibitor of Snail transcription: implications for the epithelial‐mesenchymal transition. J Cell Biol 168, 29–33. - PMC - PubMed
    1. Bailey TL, Boden M, Buske FA, Frith M, Grant CE, Clementi L, Ren J, Li WW and Noble WS (2009) MEME SUITE: tools for motif discovery and searching. Nucleic Acids Res 37, W202–W208. - PMC - PubMed
    1. Barrallo‐Gimeno A and Nieto MA (2009) Evolutionary history of the Snail/Scratch superfamily. Trends Genet 25, 248–252. - PubMed
    1. Batlle R, Alba‐Castellon L, Loubat‐Casanovas J, Armenteros E, Franci C, Stanisavljevic J, Banderas R, Martin‐Caballero J, Bonilla F, Baulida J et al (2013) Snail1 controls TGF‐β responsiveness and differentiation of mesenchymal stem cells. Oncogene 32, 3381–3389. - PMC - PubMed

Publication types

Substances