The gene regulatory program of Acrobeloides nanus reveals conservation of phylum-specific expression
- PMID: 29626130
- PMCID: PMC5924915
- DOI: 10.1073/pnas.1720817115
The gene regulatory program of Acrobeloides nanus reveals conservation of phylum-specific expression
Abstract
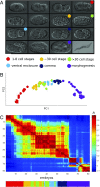
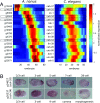
The evolution of development has been studied through the lens of gene regulation by examining either closely related species or extremely distant animals of different phyla. In nematodes, detailed cell- and stage-specific expression analyses are focused on the model Caenorhabditis elegans, in part leading to the view that the developmental expression of gene cascades in this species is archetypic for the phylum. Here, we compared two species of an intermediate evolutionary distance: the nematodes C. elegans (clade V) and Acrobeloides nanus (clade IV). To examine A. nanus molecularly, we sequenced its genome and identified the expression profiles of all genes throughout embryogenesis. In comparison with C. elegans, A. nanus exhibits a much slower embryonic development and has a capacity for regulative compensation of missing early cells. We detected conserved stages between these species at the transcriptome level, as well as a prominent middevelopmental transition, at which point the two species converge in terms of their gene expression. Interestingly, we found that genes originating at the dawn of the Ecdysozoa supergroup show the least expression divergence between these two species. This led us to detect a correlation between the time of expression of a gene and its phylogenetic age: evolutionarily ancient and young genes are enriched for expression in early and late embryogenesis, respectively, whereas Ecdysozoa-specific genes are enriched for expression during the middevelopmental transition. Our results characterize the developmental constraints operating on each individual embryo in terms of developmental stages and genetic evolutionary history.
Keywords: Nematoda; development; developmental constraints; evolution; gene expression.
Conflict of interest statement
The authors declare no conflict of interest.
Figures


Similar articles
-
Differences in maternal supply and early development of closely related nematode species.Int J Dev Biol. 2004 Sep;48(7):655-62. doi: 10.1387/ijdb.031758ml. Int J Dev Biol. 2004. PMID: 15470638
-
Comparative Transcriptomics of Steinernema and Caenorhabditis Single Embryos Reveals Orthologous Gene Expression Convergence during Late Embryogenesis.Genome Biol Evol. 2017 Oct 1;9(10):2681-2696. doi: 10.1093/gbe/evx195. Genome Biol Evol. 2017. PMID: 29048526 Free PMC article.
-
Evolution of male tail development in rhabditid nematodes related to Caenorhabditis elegans.Syst Biol. 1997 Mar;46(1):145-79. doi: 10.1093/sysbio/46.1.145. Syst Biol. 1997. PMID: 11975351
-
Evolution of developmental mechanisms in nematodes.J Exp Zool. 1999 Apr 15;285(1):3-18. doi: 10.1002/(sici)1097-010x(19990415)285:1<3::aid-jez2>3.3.co;2-a. J Exp Zool. 1999. PMID: 10327646 Review.
-
The developmental hourglass model and recapitulation: An attempt to integrate the two models.J Exp Zool B Mol Dev Evol. 2022 Jan;338(1-2):76-86. doi: 10.1002/jez.b.23027. Epub 2021 Jan 27. J Exp Zool B Mol Dev Evol. 2022. PMID: 33503326 Free PMC article. Review.
Cited by
-
Global analysis of neuropeptide receptor conservation across phylum Nematoda.BMC Biol. 2024 Oct 8;22(1):223. doi: 10.1186/s12915-024-02017-6. BMC Biol. 2024. PMID: 39379997 Free PMC article.
-
Developmental hourglass: Verification by numerical evolution and elucidation by dynamical-systems theory.PLoS Comput Biol. 2024 Feb 29;20(2):e1011867. doi: 10.1371/journal.pcbi.1011867. eCollection 2024 Feb. PLoS Comput Biol. 2024. PMID: 38422161 Free PMC article.
-
Phylogenomic Analysis of 155 Helminth Species Reveals Widespread Absence of Oxygen Metabolic Capacity.Genome Biol Evol. 2023 Aug 1;15(8):evad135. doi: 10.1093/gbe/evad135. Genome Biol Evol. 2023. PMID: 37481257 Free PMC article.
-
Parthenogenesis in dipterans: a genetic perspective.Proc Biol Sci. 2023 Mar 29;290(1995):20230261. doi: 10.1098/rspb.2023.0261. Epub 2023 Mar 22. Proc Biol Sci. 2023. PMID: 36946111 Free PMC article. Review.
-
CRISPR/Cas9 mediated gene editing in non-model nematode Panagrolaimus sp. PS1159.Front Genome Ed. 2023 Feb 3;5:1078359. doi: 10.3389/fgeed.2023.1078359. eCollection 2023. Front Genome Ed. 2023. PMID: 36818277 Free PMC article.
References
-
- Gould SJ, Lewontin RC. The spandrels of San Marco and the Panglossian paradigm: A critique of the adaptationist programme. Proc R Soc Lond B Biol Sci. 1979;205:581–598. - PubMed
-
- Zalts H, Yanai I. Developmental constraints shape the evolution of the nematode mid-developmental transition. Nat Ecol Evol. 2017;1:113. - PubMed
-
- Arthur W. A Theory of the Evolution of Development. John Wiley & Sons Incorporated; Hoboken, NJ: 1988.
-
- Valentine JW, Jablonski D, Erwin DH. Fossils, molecules and embryos: New perspectives on the Cambrian explosion. Development. 1999;126:851–859. - PubMed
-
- Angelini DR, Kaufman TC. Comparative developmental genetics and the evolution of arthropod body plans. Annu Rev Genet. 2005;39:95–119. - PubMed
Publication types
MeSH terms
Grants and funding
LinkOut - more resources
Full Text Sources
Other Literature Sources

