Similar neural responses predict friendship - PubMed Skip to main page content
U.S. flag

An official website of the United States government

Dot gov

The .gov means it’s official.
Federal government websites often end in .gov or .mil. Before sharing sensitive information, make sure you’re on a federal government site.

Https

The site is secure.
The https:// ensures that you are connecting to the official website and that any information you provide is encrypted and transmitted securely.

Access keys NCBI Homepage MyNCBI Homepage Main Content Main Navigation
. 2018 Jan 30;9(1):332.
doi: 10.1038/s41467-017-02722-7.

Similar neural responses predict friendship

Affiliations

Similar neural responses predict friendship

Carolyn Parkinson et al. Nat Commun. .

Abstract

Human social networks are overwhelmingly homophilous: individuals tend to befriend others who are similar to them in terms of a range of physical attributes (e.g., age, gender). Do similarities among friends reflect deeper similarities in how we perceive, interpret, and respond to the world? To test whether friendship, and more generally, social network proximity, is associated with increased similarity of real-time mental responding, we used functional magnetic resonance imaging to scan subjects' brains during free viewing of naturalistic movies. Here we show evidence for neural homophily: neural responses when viewing audiovisual movies are exceptionally similar among friends, and that similarity decreases with increasing distance in a real-world social network. These results suggest that we are exceptionally similar to our friends in how we perceive and respond to the world around us, which has implications for interpersonal influence and attraction.


Conflict of interest statement

The authors declare no competing financial interests.

Figures
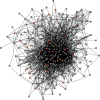
Fig. 1
Fig. 1
Social network. The social network of an entire cohort of first-year graduate students was reconstructed based on a survey completed by all students in the cohort (N = 279; 100% response rate). Nodes indicate students; lines indicate mutually reported social ties between them. A subset of students (orange circles; N = 42) participated in the fMRI study
Fig. 2
Fig. 2
Computing inter-subject time series correlations. a Eighty anatomical regions of interest (ROIs) were derived for each individual using the FreeSurfer image analysis suite. Segmentation of cerebral cortex, subcortical white matter, and deep gray matter volumetric structures (e.g., hippocampus, amygdala, and putamen) was performed on the high-resolution scan of each individual’s brain volume. These structures are signified by color in the image demonstrating volumetric segmentation (e.g., the left and right cerebral cortex are shown in magenta and purple, respectively). Next, a cortical surface model was reconstructed and parcellated into anatomical units, which are signified by different colors in the cortical parcellation scheme illustrated on the far right. b For each individual, the average response time series within each ROI was extracted during video viewing. Next, the correlation between the time series extracted from each pair of corresponding ROIs was computed for each unique pair of subjects
Fig. 3
Fig. 3
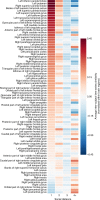
Inter-subject similarities for each brain region at each level of social distance. Inter-subject correlations of neural response time series for each of the 861 dyads were obtained for each of 80 anatomical regions of interest (ROIs). In order to illustrate how relative similarities of responses in each brain region varied as a function of social distance, inter-subject time series similarities (i.e., Pearson correlation coefficients between preprocessed fMRI response time series) were normalized (i.e., z-scored across dyads for each region) prior to averaging across dyads for each brain region within each social distance category. Warmer colors indicate relatively similar responses for a given brain region; cooler colors indicate relatively dissimilar responses for that brain region. Please note that because similarities have been normalized across dyads for each brain region, values depicted in this figure should be compared across social distance levels for each brain region, rather than across brain regions within or across social distances
Fig. 4
Fig. 4
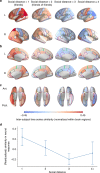
Inter-subject similarities by social distance. ac Average dyadic fMRI response time series similarities overlaid on a cortical surface model (a lateral view; b medial view; c ventral view). In order to illustrate how relative similarities of responses in each brain region varied as a function of social distance, inter-subject time series similarities (i.e., Pearson correlation coefficients between preprocessed fMRI response time series) were normalized (i.e., z-scored across dyads for each region) prior to averaging across dyads for each brain region and overlaying results on an inflated model of the cortical surface for each social distance category. Warmer colors indicate relatively similar responses for a given brain region; cooler colors indicate relatively dissimilar responses for that brain region. Please note that because similarities have been normalized across dyads for each brain region, values depicted in this figure should be compared across social distance levels for each brain region, rather than across brain regions within or across social distances. Please see Fig. 3 for presentation of results that include subcortical gray matter structures. Ant. = anterior; Post. = posterior; L = left; R = right. d Deviation-coded point estimates and 95% CIs for weighted average neural similarities, after accounting for inter-subject similarities in control variables (demographic variables and handedness) are shown for distance 1 (deviation-coded point estimate = 0.23, 95% CI [0.07, 0.41]), distance 2 (deviation-coded point estimate = 0.03, 95% CI [−0.11, 0.17]), distance 3 (deviation-coded point estimate = −0.20, 95% CI [−0.30, −0.09]), and distance 4 (deviation-coded point estimate = −0.07, 95% CI [−0.29, 0.14]) dyads. Deviation coding measures the difference in overall neural similarity between dyads within each social distance category and the average overall neural similarity of dyads in the other social distance categories, after removing the effects of control variables. For further details on deviation coding, please refer to the Supplementary Methods. Cortical surface visualizations were created using PySurfer
Fig. 5
Fig. 5
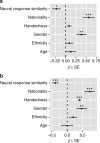
Regression coefficients from models predicting social distance and friendship status. Regression coefficients correspond to weighted average neural response similarities and dissimilarities in control variables. a Illustration of regression coefficients from an ordered logistic regression model in which social distance was predicted based on the similarity of participants’ neural response time series, as well as dissimilarities in control variables. b Illustration of regression coefficients from a logistic regression model in which friendship status was predicted based on the similarity of participants’ neural response time series, as well as dissimilarities in control variables. Error bars indicate standard errors of the regression coefficients estimated using multi-way clustering to account for dyadic dependencies in the data set. ***p < 0.001, **p <0.01, *p < 0.05
Fig. 6
Fig. 6
Testing associations between neural response similarity and social distance by brain region. As described in the main text, ordered logistic regression analyses were carried out for each brain region in which social network distances were modeled as a function of local neural response similarities and dyadic dissimilarities in control variables (gender, ethnicity, nationality, age, and handedness). Negative regression coefficients for neural response similarity indicate that greater neural response similarity was associated with decreased social distance. Regression coefficients for the effects of neural response similarity on social distance for each cortical ROI are shown overlaid on a lateral, b medial, and c ventral views of the cortical surface. Ant. = anterior; Post. = posterior. In each view, the left hemisphere is displayed on the left. Cortical surface visualizations were created using PySurfer. Warmer colors indicate negative regression coefficients (i.e., where greater neural response similarity was associated with social network proximity), whereas cooler colors indicate positive regression coefficients (i.e., where greater neural response similarity was associated with increased social distance). d Regions where neural similarity was significantly predictive of social distance, above and beyond the effects of control variables (p < 0.05, FDR-corrected, two-tailed) are shown in yellow, with marginally significant regions (p < 0.08) shown in blue, and all other regions shown in gray. Error bars indicate cluster-robust standard errors of the regression coefficients
Fig. 7
Fig. 7
Results of permutation testing based on network randomization. Histograms depict the distribution of average overall neural similarities for a distance 1, b distance 2, c distance 3, and d distance 4 dyads across 1000 permutations of the data set in which fMRI responses were randomly shuffled across participants while the topological structure of the network of social connections between those participants was held constant. Red dashed lines depict the actual neural response similarities (i.e., based on the non-permuted data) for dyads corresponding to each social distance category. Results of these permutation tests indicated that distance 1 dyads (N = 63) were more similar than would be expected based on chance (p = 0.03), distance 2 dyads (N = 286) were marginally more similar than would be expected based on chance (p = 0.06), and distance 3 dyads (N = 412) were less similar to one another than would be expected based on chance (p = 0.003). Distance 4 dyads (N = 100) were neither more nor less similar to one another than would be expected if there were no relationship between overall neural response similarity and proximity in the social network (p = 0.5)
Fig. 8
Fig. 8
Predicting social distance based on inter-subject neural similarities. a Confusion matrix summarizing cross-validated prediction accuracy of four-way classifiers trained to predict the geodesic distance between members of dyads in their social network based on patterns of neural similarity, averaged across data folds (see Methods for further details). Numbers and cell colors indicate how often the classifier predicted that dyads belonged to each social distance category (chance = 0.25). b Permutation testing was used to compare the overall cross-validated prediction accuracy to random chance. The distribution of accuracies achieved by repeating the classification analyses after randomly shuffling the data category labels in the training folds 1000 times is shown in blue; the black dashed line depicts the average level of accuracy achieved in the randomly permuted data. The red dashed line indicates the actual overall cross-validated classification accuracy, which significantly exceeded chance (p = 0.004)

Comment in

  • Birds of a Feather Synchronize Together.
    Lieberman MD. Lieberman MD. Trends Cogn Sci. 2018 May;22(5):371-372. doi: 10.1016/j.tics.2018.03.001. Epub 2018 Mar 13. Trends Cogn Sci. 2018. PMID: 29548666 No abstract available.

Similar articles

Cited by

References

    1. Titelman, G. Random House Dictionary of Popular Proverbs and Sayings (Random House, New York, 1996).
    1. McPherson M, Smith-Lovin L, Cook JM. Birds of a feather: homophily in social networks. Annu. Rev. Sociol. 2001;27:415–444. doi: 10.1146/annurev.soc.27.1.415. - DOI
    1. Fu F, Nowak MA, Christakis NA, Fowler JH. The evolution of homophily. Sci. Rep. 2012;2:845. doi: 10.1038/srep00845. - DOI - PMC - PubMed
    1. Apicella CL, Marlowe FW, Fowler JH, Christakis NA. Social networks and cooperation in hunter-gatherers. Nature. 2012;481:497–501. doi: 10.1038/nature10736. - DOI - PMC - PubMed
    1. Lewis K, Gonzalez M, Kaufman J. Social selection and peer influence in an online social network. Proc. Natl Acad. Sci. USA. 2012;109:68–72. doi: 10.1073/pnas.1109739109. - DOI - PMC - PubMed

Publication types