Morphology of travel routes and the organization of cities
- PMID: 29263392
- PMCID: PMC5738436
- DOI: 10.1038/s41467-017-02374-7
Morphology of travel routes and the organization of cities
Abstract
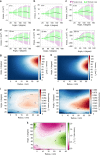
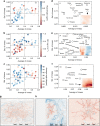
The city is a complex system that evolves through its inherent social and economic interactions. Mediating the movements of people and resources, urban street networks offer a spatial footprint of these activities. Of particular interest is the interplay between street structure and its functional usage. Here, we study the shape of 472,040 spatiotemporally optimized travel routes in the 92 most populated cities in the world, finding that their collective morphology exhibits a directional bias influenced by the attractive (or repulsive) forces resulting from congestion, accessibility, and travel demand. To capture this, we develop a simple geometric measure, inness, that maps this force field. In particular, cities with common inness patterns cluster together in groups that are correlated with their putative stage of urban development as measured by a series of socio-economic and infrastructural indicators, suggesting a strong connection between urban development, increasing physical connectivity, and diversity of road hierarchies.
Conflict of interest statement
The authors declare that they have no competing financial interests.
Figures


Similar articles
-
Characterizing network circuity among heterogeneous urban amenities.J R Soc Interface. 2023 Nov;20(208):20230296. doi: 10.1098/rsif.2023.0296. Epub 2023 Nov 1. J R Soc Interface. 2023. PMID: 37907093 Free PMC article.
-
Understanding congested travel in urban areas.Nat Commun. 2016 Mar 15;7:10793. doi: 10.1038/ncomms10793. Nat Commun. 2016. PMID: 26978719 Free PMC article.
-
Slum upgrading strategies involving physical environment and infrastructure interventions and their effects on health and socio-economic outcomes.Cochrane Database Syst Rev. 2013 Jan 31;(1):CD010067. doi: 10.1002/14651858.CD010067.pub2. Cochrane Database Syst Rev. 2013. PMID: 23440845 Review.
-
[Third World cities: points of accumulation, centers of distribution].Tiers Monde (1960). 1985 Oct-Dec;26(104):823-40. Tiers Monde (1960). 1985. PMID: 12267619 French.
-
Health impacts of the M74 urban motorway extension: a mixed-method natural experimental study.Southampton (UK): NIHR Journals Library; 2017 Apr. Southampton (UK): NIHR Journals Library; 2017 Apr. PMID: 28459514 Free Books & Documents. Review.
Cited by
-
The temporal network of mobile phone users in Changchun Municipality, Northeast China.Sci Data. 2018 Oct 30;5:180228. doi: 10.1038/sdata.2018.228. Sci Data. 2018. PMID: 30375989 Free PMC article.
-
Characterizing network circuity among heterogeneous urban amenities.J R Soc Interface. 2023 Nov;20(208):20230296. doi: 10.1098/rsif.2023.0296. Epub 2023 Nov 1. J R Soc Interface. 2023. PMID: 37907093 Free PMC article.
-
From the betweenness centrality in street networks to structural invariants in random planar graphs.Nat Commun. 2018 Jun 27;9(1):2501. doi: 10.1038/s41467-018-04978-z. Nat Commun. 2018. PMID: 29950619 Free PMC article.
-
A unified spatial multigraph analysis for public transport performance.Sci Rep. 2020 Jun 12;10(1):9573. doi: 10.1038/s41598-020-65175-x. Sci Rep. 2020. PMID: 32532999 Free PMC article.
-
Data-driven strategies for optimal bicycle network growth.R Soc Open Sci. 2020 Dec 16;7(12):201130. doi: 10.1098/rsos.201130. eCollection 2020 Dec. R Soc Open Sci. 2020. PMID: 33489269 Free PMC article.
References
Publication types
LinkOut - more resources
Full Text Sources
Other Literature Sources

