Active Touch and Self-Motion Encoding by Merkel Cell-Associated Afferents - PubMed Skip to main page content
U.S. flag

An official website of the United States government

Dot gov

The .gov means it’s official.
Federal government websites often end in .gov or .mil. Before sharing sensitive information, make sure you’re on a federal government site.

Https

The site is secure.
The https:// ensures that you are connecting to the official website and that any information you provide is encrypted and transmitted securely.

Access keys NCBI Homepage MyNCBI Homepage Main Content Main Navigation
. 2017 May 3;94(3):666-676.e9.
doi: 10.1016/j.neuron.2017.03.045. Epub 2017 Apr 20.

Active Touch and Self-Motion Encoding by Merkel Cell-Associated Afferents

Affiliations

Active Touch and Self-Motion Encoding by Merkel Cell-Associated Afferents

Kyle S Severson et al. Neuron. .

Abstract

Touch perception depends on integrating signals from multiple types of peripheral mechanoreceptors. Merkel-cell associated afferents are thought to play a major role in form perception by encoding surface features of touched objects. However, activity of Merkel afferents during active touch has not been directly measured. Here, we show that Merkel and unidentified slowly adapting afferents in the whisker system of behaving mice respond to both self-motion and active touch. Touch responses were dominated by sensitivity to bending moment (torque) at the base of the whisker and its rate of change and largely explained by a simple mechanical model. Self-motion responses encoded whisker position within a whisk cycle (phase), not absolute whisker angle, and arose from stresses reflecting whisker inertia and activity of specific muscles. Thus, Merkel afferents send to the brain multiplexed information about whisker position and surface features, suggesting that proprioception and touch converge at the earliest neural level.

Keywords: active sensation; barrel cortex; neural coding; perception; primary afferents; proprioception; reafferent; sensorimotor integration; somatosensation; whisker system.


Figures

Figure 1
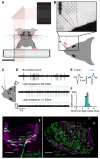
Figure 1. Recording spikes from Merkel afferents during active touch
(A) Schematic of experimental setup. A mouse whisked against a small vertical pole while head-fixed and running on a treadmill. High-speed video (500 Hz) of whiskers were obtained at the same time as electrophysiological recordings from primary afferents in the trigeminal ganglion. (B) Image from high-speed video overlaid with example grid showing the set of pole locations used during one afferent recording. The shadow from part of the mouse face and the pole in one location (and its holder) are evident. One row of whiskers was left intact. A whisker in contact with the pole is highlighted in red. Whisker position (θ) was measured as angular displacement from the medial-lateral axis. (C) Schematic of in vivo identification of Merkel-associated afferents by optogenetic tagging. The whisker pad was illuminated with blue light (bolt) while a recording was made from a whisker-responsive neuron in the trigeminal ganglion. Action potentials triggered by photostimulation (blue waveform) of the peripheral axon propagated to the cell body where they were recorded. (D) Example electrophysiology traces showing spikes of a primary afferent responsive to stimulation of the B3 whisker (top) and to photostimulation targeted to the B3 whisker follicle (middle), but not to photostimulation of the nearby C1 whisker follicle (bottom). Vertical blue ticks: 2 ms light pulse. (E) Spike waveforms (mean ± SD) in response to touch (black) and light (blue) were nearly identical (shading: SD). (F) Histogram of latencies from light onset to time of spike (peak or trough) recorded in TG, for neuron shown in (D). Spikes occurred with short latency (mean: 3.6 ms) and low jitter (SD: 0.3 ms). (G) Projection through a confocal z-stack of a single whisker follicle (region of the ring sinus) showing a single channelrhodopsin-2 (ChR2)-expressing afferent (green), associating with Merkel cells (magenta). Merkel cells are labeled by keratin 8 (Krt8, TROMA-I) staining. White arrow: direction of skin surface. (H) Coronal section through the trigeminal ganglion of a TrkCCreER;RosaAi32 mouse showing ChR2 expression (green) in both cell bodies and processes. Cell bodies are labeled by NeuN staining (magenta). See also Figure S1.
Figure 2
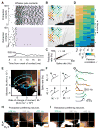
Figure 2. Merkel and unidentified afferents respond to both active touch and self-motion
(A) Zoomed region of a high-speed video frame showing a whisker in contact with the pole. Whisker-pole contact force (F⇀) can be decomposed into the force components acting along the axis of the whisker ( Fax) and lateral to the face ( Flat). Magnitudes of these forces and of the bending moment ( M0) induced by F⇀ were estimated for each video frame. (B) Example time series for a Merkel afferent. One second of electrophysiological recording (top trace) is shown with mechanical variables estimated from the high-speed video, including whisker angular position (θ), phase of θ within the whisk cycle (ϕ), whisker angular velocity (ω), whisker angular acceleration (α), whisker angular jerk (ζ), and magnitude of contact-induced moment (M0), axial force (Fax) and lateral force (Flat). Periods of whisker-pole contact are indicated by lavender shading. (C) Mean spike rates of neurons during periods when the mouse was not whisking (light gray symbols), during whisking in free air (dark gray), and during whisker-pole contact (lavender). Error bars indicate 95% bootstrap confidence intervals of the means. Data points for each neuron are connected by black lines. Neurons are sorted along the horizontal axis by rapidly adapting (lower red bar) or slowly adapting (lower gray bar) properties, positive Merkel afferent identification (lower blue bar), and sensitivity to touch (T, upper dashed bars) or to both whisking and touch (WT, upper solid bars). A subset of afferents especially sensitive to whisking in air (referred to as “WT*” in the text) are indicated with asterisks. See also Video S1.
Figure 3
Figure 3. Active touch encoding via sensitivity to bending moment and its rate of change
(A) Example rasters showing spiking of a Merkel afferent for 100 randomly selected protraction (top raster) and retraction (bottom raster) contacts. Lavender shading indicates contact (2 ms resolution). Shown at bottom are mean spike rates aligned to contact onset for all protraction (solid, ± SEM, n = 4,392 total) and retraction (dashed ± SEM; n = 1,556 total) contacts. Spike rate differences prior to contact in the two rasters are due to differences in tuning to protraction and retraction self-motion. (B) Mean spike rate (indicated by colors) during contact at each pole location (top) for an example SA afferent, and predicted spike rate from the “full” GAM statistical model (STAR Methods) fitted to predict instantaneous spikes from this neuron (bottom). The color scale for both panels is identical and ranges from 51 to 367 Hz. (C) Actual versus predicted mean spike rates during contact, pooled across neurons and pole locations (data for each neuron as in [B]). (D) Heatmap showing the Pearson correlation coefficient, r, between recorded spikes (smoothed by Gaussian kernel with σ = 4 ms) and predicted spike rates from GAM models (columns) fitted for each neuron (rows; blue circles: Merkel afferents) based on different combinations of mechanical variables. (E) Tuning surface for example Merkel afferent (same as in [A]) showing mean spike rate (color scale) binned by moment (M0) and its rate of change (M0′). Trajectories (colored curves) for example contacts are plotted on top of the surface. Each contact begins near the origin and proceeds counter-clockwise across either the top (for protraction) or bottom (for retraction) half of the tuning surface. Dashed lines indicate axis origins. Bins with fewer than 25 observations are white. (F) Schematic depicting the four quadrants of the M0M0′ tuning surface shown in (E). The whisker can be moving in the protraction or retraction direction, and be in contact with a pole either in front of or behind the whisker. (G) Spike times shown individually (ticks) and smoothed (colored curves, Gaussian kernel with σ = 2 ms) for the example trajectories in (E), overlaid with spike rate “read off” from the tuning surface (black dashed traces). (H) Example M0M0′ tuning surfaces for three neurons that preferred protraction contacts (leftmost neuron from [E]). (I) Same as (H) but for three neurons that preferred retraction touches. (HI) Dashed lines indicate the origin of each axis and are colored by afferent type (blue: Merkel; gray: SA). The color scale for each surface ranges from 0 Hz to a maximum spike rate indicated above the surface (blue text: Merkel). Scale bars (red) indicate 2 × 10⁻⁷ N-m and 2 × 10⁻⁸ N-m ms−1 for M0 and M0′, respectively. White bins as in (E). See also Figure S2.
Figure 4
Figure 4. A simple mechanical model predicts responses to active touch
(A) Schematic of the model. Moment at the base of the whisker causes strain on a spring and dashpot arranged in parallel. Variables representing elastic (σspring) and viscous (σdashpot) stresses are summed (σtotal) and scaled (to a maximum of 1,000 Hz) to yield spike rate. (B) Example model dynamics for a single touch. Top, Example trace of moment (M0) during a protraction contact for a recording from a Merkel afferent (dashed gray line: M0 = 0). Middle, Elastic (red) and viscous (blue) stress variables and their sum (black; dashed gray: σ = 0). Bottom, Individual spike times (gray ticks) aligned to the M0 trace. Spike rate predicted from the viscoelastic model (orange) matched that predicted from the M0M0′ tuning surface (dashed black; left surface shown in [D]). This example represents a challenging trajectory containing wide ranges of M0 and M0′. (C) Viscoelastic model performance was similar to that of GAM statistical models based on M0 and M0′. Performance of each model was quantified by the Pearson correlation coefficient, r, between model-predicted spike rates and recorded spike rates (smoothed by Gaussian kernel with σ = 4 ms). Plot symbols show individual Merkel (blue circles, n = 14) and SA (black circles, n = 11; one SA excluded because model fitting failed) afferents and the mean ± 95% bootstrap confidence interval (black lines). (D) Tuning surfaces for real data (left) and simulated from the model (right). Color scale ranges from 0 to 500 Hz. Conventions as in Figure 3E.
Figure 5
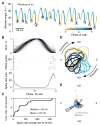
Figure 5. Self-motion responses encode whisk phase
(A) Example whisker position trace overlaid with spike times (black circles) for a Merkel afferent during whisking in air. Color scale depicts phase within the whisk cycle. Spikes occurred near full retraction (phase of −π/π) during whisking. (B) Normalized and superimposed whisker position traces (top) and spike time raster (middle) for 200 whisk cycles randomly chosen from 6,325 total cycles, and mean spike rate (bottom; the “phase tuning curve”; ± SEM across all 6,325 cycles). Same afferent as in (A). (C) Cumulative histogram showing spike rate changes due to phase modulation (maximum minus minimum of the phase tuning curve) for WT* afferents (n = 15, including 5 Merkel, 9 SA and 1 RA). (D) Normalized phase tuning curves for WT* afferents in polar coordinates (n = 15). Preferred phase of each afferent is indicated by colors (color scale as in A). Merkel afferents (n = 5) include the black curve (example from A) and those with black outline. (E) Polar histogram showing the distribution of preferred phases (peak of tuning curves from D; blue: Merkels). See also Figure S3.
Figure 6
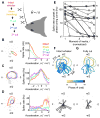
Figure 6. Self-motion responses arise from both external and internal stresses
(A) Schematic of the experiment. Responses during whisking in air were recorded across progressive cuts to shorten the relevant whisker and decrease its moment of inertia, I (resistance to change in angular motion). Bending moment at the base of the whisker (M⇀), proportional to I and angular acceleration (α⇀), was thus progressively reduced. As a control, prior to cutting the whisker was it was handled in a sham manipulation. (B) Tuning curves for phase (left) and acceleration (right; ± SEM) are shown for an example SA afferent across cutting conditions (colors, as in A). Afferent showed gradual reduction of spike rates down to zero as the whisker was progressively cut to its base (i.e. when I ~ 0). Note that preferred phase remained constant as overall spike rate decreased. (C) Example SA afferent with little change in responses after progressive cutting even in the “fully cut” condition. Conventions as in (B). (D) Example SA afferent with response that were reduced but not eliminated by cutting. Conventions as in (B). (E) Summary showing spike rate at the preferred phase for each afferent (n = 13 SA), as a function of the remaining whisker moment of inertia (normalized to intact condition). Examples from (BD) are plotted with thick lines and indicated at right by corresponding lower case letters (b,c,d). A log scale for the spike rate axis accommodates the wide range across afferents. (F) Overlay of normalized phase tuning curves (top) and histogram of preferred phases (bottom) for each afferent (n = 13 SA) from the intact whisker condition. Conventions as in Figure 5D–E. (G) As in (F) but for fully cut whisker conditions (n = 7; only neurons with ≥ 3 Hz peak response). See also Video S2.
Figure 7
Figure 7. Phase coding reflects tuning to inertial and muscle-specific stresses
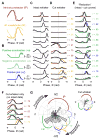
(A) Electromyogram (EMG) as a function of whisk phase is shown for two main whisking muscles, the intrinsic protractors (top, solid brown; mean ± SD across n = 3 mice), and the extrinsic retractor m. nasolabialis (bottom, solid yellow; n = 1 mouse). Overlaid are published rat EMG data for the same muscles (dashed curves; obtained from Hill et al. 2008). (B) Absolute values of positive acceleration (+α; top, dark green), negative acceleration (−α; middle, light green) and positive jerk (+ζ; bottom, dark blue) as a function of whisk phase (mean ± SD after setting values with opposite sign to 0; n = 53 recording sessions). (C) Normalized phase tuning curves for afferents in the progressive whisker cutting experiment, prior to cutting (same afferents as in Figure 6E). Dashed lines indicate phase 0 (vertical dashed lines) and spike rate 0 (horizontal) and are colored by afferent type (gray: SA, n = 13; red: RA, n = 1). (D) Afferents from (C) shown for the fully cut whisker condition. Afferents are aligned by rows with (C) and displayed on the same vertical scale (normalized across intact and cut conditions). Mouse EMG traces from (A) are overlaid for each afferent based on the best match (Pearson correlation coefficient between EMG and spike rate tuning curves, r, shown to right of each curve; NA: correlation not computed due to zero spikes). (E) Same afferents as in (C, D), aligned by rows and with same normalization, but showing apparent “reduction” in spike rate at each phase, obtained by subtracting cut from intact whisker tuning curves. Negative values were set to zero. Mean kinematics traces from (B) are overlaid for each afferent based on the best match (Pearson correlation coefficient, r, between curves; shown to right of each pair of curves; matches chosen from among ±α and ±ζ). (F) Same as (D) but for additional afferents (n = 3 Merkel and n = 2 SA; Merkels: blue dashed lines) recorded after the whisker had already been cut. (G) Summary polar histogram showing preferred phase for all WT* afferents (n = 28, including 5 Merkels, 22 SA and 1 RA; blue bars: Merkels). Colored traces illustrate the normalized kinematics and EMG curves from (A, B) in polar coordinates (shown dashed and gray below 75th percentile for clarity). Inset, histogram of preferred phase for all recordings in which the whisker was fully cut (n = 12 including 3 Merkel and 9 SA; n = 6 not plotted due to ≤ 3 Hz peak rate). See also Figures S4–6.

Similar articles

Cited by

References

    1. Abraira VE, Ginty DD. The sensory neurons of touch. Neuron. 2013;79:618–639. - PMC - PubMed
    1. Bagdasarian K, Szwed M, Knutsen PM, Deutsch D, Derdikman D, Pietr M, Simony E, Ahissar E. Pre-neuronal morphological processing of object location by individual whiskers. Nat Neurosci. 2013;16:622–631. - PubMed
    1. Bai L, Lehnert BP, Liu J, Neubarth NL, Dickendesher TL, Nwe PH, Cassidy C, Woodbury CJ, Ginty DD. Genetic Identification of an Expansive Mechanoreceptor Sensitive to Skin Stroking. Cell. 2015;163:1783–1795. - PMC - PubMed
    1. Bale MR, Campagner D, Erskine A, Petersen RS. Microsecond-scale timing precision in rodent trigeminal primary afferents. J Neurosci. 2015;35:5935–5940. - PMC - PubMed
    1. Bermejo R, Szwed M, Friedman W, Ahissar E, Zeigler HP. One whisker whisking: unit recording during conditioned whisking in rats. Somatosens Mot Res. 2004;21:183–187. - PubMed

LinkOut - more resources