Instrumented cardiac microphysiological devices via multimaterial three-dimensional printing - PubMed Skip to main page content
U.S. flag

An official website of the United States government

Dot gov

The .gov means it’s official.
Federal government websites often end in .gov or .mil. Before sharing sensitive information, make sure you’re on a federal government site.

Https

The site is secure.
The https:// ensures that you are connecting to the official website and that any information you provide is encrypted and transmitted securely.

Access keys NCBI Homepage MyNCBI Homepage Main Content Main Navigation
. 2017 Mar;16(3):303-308.
doi: 10.1038/nmat4782. Epub 2016 Oct 24.

Instrumented cardiac microphysiological devices via multimaterial three-dimensional printing

Affiliations

Instrumented cardiac microphysiological devices via multimaterial three-dimensional printing

Johan U Lind et al. Nat Mater. 2017 Mar.

Abstract

Biomedical research has relied on animal studies and conventional cell cultures for decades. Recently, microphysiological systems (MPS), also known as organs-on-chips, that recapitulate the structure and function of native tissues in vitro, have emerged as a promising alternative. However, current MPS typically lack integrated sensors and their fabrication requires multi-step lithographic processes. Here, we introduce a facile route for fabricating a new class of instrumented cardiac microphysiological devices via multimaterial three-dimensional (3D) printing. Specifically, we designed six functional inks, based on piezo-resistive, high-conductance, and biocompatible soft materials that enable integration of soft strain gauge sensors within micro-architectures that guide the self-assembly of physio-mimetic laminar cardiac tissues. We validated that these embedded sensors provide non-invasive, electronic readouts of tissue contractile stresses inside cell incubator environments. We further applied these devices to study drug responses, as well as the contractile development of human stem cell-derived laminar cardiac tissues over four weeks.


Conflict of interest statement

Competing Financial Interests

The authors declare no competing financial interests

Figures
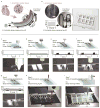
Figure 1
Figure 1. Device principle and microscale 3D-printing procedure
(a) Principle sketch of the device. Contraction of an anisotropic engineered cardiac tissue (1) deflects a cantilever substrate (2), thereby stretching a soft strain gauge embedded in the cantilever. This generates a resistance change proportional to the contractile stress of the tissue (3). (b) The fully printed final device. Insert 1: Confocal microscopy image of immuno-stained laminar NRVM cardiac tissue on the cantilever surface. Blue: DAPI nuclei stain, White: α-actinin, scale bar 10 μm. Insert 2: Still images of a cantilever deflecting upon tissue contraction. Insert 3: Example resistance signal. (c–i) Automated printing of the device on a 2 inch x 3 inch glass slide substrate in 7 sequential steps. For each step, a corresponding still image from the printing procedure is displayed. For steps 1–5, a stylus profiling cross-sectional contour of the cantilever is additionally displayed. (c) In print step 1, a 0.5 μm Dextran thin film sacrificial layer is printed (d) In print step 2, a 3 μm TPU thin film cantilever base is printed (e) In print step 3, a 6.5 μm thick CB:TPU strain sensor loop is added to cantilever base. (f) In print step 4, a 1.5 μm TPU wire cover is added. (g) In print step 5, 20 μm tall, 60 μm wide PDMS micro-filaments are printed in slightly overlapping lines. The filaments constitute the top part of the cantilever and guide cardiomyocytes to form anisotropic laminar tissues. (h) In print step 6, electrical leads and contact are added using a high conductivity Ag:PA ink (i) In print step 7, covers to insulate exposed wires and wells to contain cells and media are printed using PDMS, PLA or ABS (See supplementary Fig S10).
Figure 2
Figure 2. Micro-grooves guide cardiomyocyte self-assembly into anisotropic engineered tissues
(a) Spacing of soft PDMS microfilaments (b) Sketch of micro-filaments guiding self-assembly of engineered cardiac tissue. (c) Stylus profilometer contours of substrates with filaments printed at 40, 60, 80 and 100 μm spacing. (d) Sarcomere OOP of laminar NRVM tissues developed on substrates with 40 (n=9), 60 (n=13), 80 (n=8) and 100 μm (n=10) filament spacing, error bars are S.E.M., *: P<0.05. (e–f) Representative confocal images from OOP dataset, Blue: DAPI nuclei stain, White: α-actinin (e) z-projection, scale bars 10 μm (f) x-z line scan. (g) Ratio between action potential (AP) propagation speed parallel and orthogonal to the grooves for laminar NRVM tissue developed on substrates with 40, 60, 80 and 100 μm filament spacing, (n≥3). Individual data points included (circles), error bars are S.E.M. (h) Representative activation time heat maps for AP data set, overlaid wide field microscope image of the samples as guide to the eye, scale bars 0.8 mm. Activation times normalized to maximum observed activation (tmax, Red), to account for tissue source variation. 2 Hz electrical point-stimulation is applied in top left corner of samples. Mean observed propagation speed parallel (Vpara) and orthogonal (Vortho) to grooves is displayed as vectors. (i) Normalized AP traces at four corners of activation map samples. Blue: at AP initiation corner, Red: At tmax-corner, Black: Corner parallel to grooves, Green: Corner orthogonal to grooves.
Figure 3
Figure 3. CB:TPU gauge factor, sensor readout and example drug-dose studies
(a) Sketch of Instron test setup for determining CB:TPU gauge factor (GF). (b–d) Relative change in CB:TPU resistance upon triangular cyclic straining to 0.1% at 1 Hz. (c) Dark grey line: Observed relative resistance change. Red dotted line: Strain applied. (d) Relative resistance change vs. applied strain. Orange dotted line indicates linear fit to part of cycles with increasing strain yielding a gauge factor of 2.56. (e) Wide-field microscope images of cantilever bending upon tissue contraction. Minimum deflection corresponds to cardiac diastole (1) and peak deflection corresponding to systole (2). (f) Sketch of mechanical model applied to convert resistance change to stress generated by the tissue, see supplementary information. (g–h) Relative resistance changes (left axis) and corresponding calculated tissue stress (right axis) recorded from spontaneously beating cantilever. Blue dotted line in (h) indicates stress determined independently by optical tracking of the cantilever radius of curvature. (i) Representative traces of stress generated by a laminar NRVM tissue when tissue is exposed to verapamil and corresponding dose-response curve (n=4), error bars are S.E.M, stress normalized between maximal and minimal values, tissue paced at 1 Hz, apparent EC50 1.12x10⁻⁶ M. Individual data points included (circles) (j) Representative traces of stress generated by a laminar hiPS-CM tissue when exposed to isoproterenol and corresponding dose-response curve, (n=10), error bars are S.E.M, stress normalized between maximal and minimal values, tissue paced at 2 Hz, apparent EC50 2.74x10⁻⁹ M.
Figure 4
Figure 4. Long term hips-CM contractile development and thicker laminar NRVM tissue devices
(a) Representative traces of contractile twitch stress generated by the laminar hiPS-CMs tissues at day 2, 14 and 28 (b–c) Contractile stress and spontaneous beat rate of hiPS-CMs tissues at day 2, 4, 8, 20 and 28 (n≥10) error bars are S.E.M. (d) Immuno-stained laminar hiPS-CMs tissues on device cantilevers at day 2 and day 28 after seeding, scale bars 10 μm. Blue: DAPI nuclei stain White: α-actinin stain, z-projection (e–g) SPD, OOP and sarcomere length of laminar hiPS-CM tissues at day 2, 14 and 28 (n=5) error bars are S.E.M., *: P<0.05. (h) 1: Modified device cantilever containing micro-pin and micro-well to support thicker laminar NRVM tissue, 2: Detail of cantilever with micro-pins 3: Still images of a cantilever deflecting upon tissue contraction. (i) 1: z-projection of immuno-stained thicker laminar tissue on the cantilever surface with micro-pin, scale bar 30 μm. 2: x-z line scan of thicker laminar tissue in grooves, scale bar 10 μm, Blue: DAPI nuclei stain, White: α-actinin, Red: actin. (j–k) Dose-response curves for thicker laminar NRVM tissues. Stress values for thicker tissues assumed linear proportional to relative resistance change: σ~ΔR/R0. Stress normalized between maximal and minimal values. (j) Dose-response curve for verapamil, (n=4), error bars are S.E.M. Individual data points included (circles), tissue paced at 1.5 Hz. Apparent EC50 7.90x10⁻⁷ M (k) Dose-response curve for isoproterenol, (n=3) error bars are S.E.M. Individual data points included (circles), tissue paced at 1.5 Hz. Apparent EC50 1.16x10⁻⁹ M.

Comment in

Similar articles

Cited by

References

    1. Bhatia SN, Ingber DE. Microfluidic organs-on-chips. Nature biotechnology. 2014;32:760–772. - PubMed
    1. Mammoto A, et al. Control of lung vascular permeability and endotoxin-induced pulmonary oedema by changes in extracellular matrix mechanics. Nature communications. 2013;4:1759. - PubMed
    1. Feinberg AW, et al. Muscular thin films for building actuators and powering devices. Science. 2007;317:1366–1370. - PubMed
    1. Boudou T, et al. A microfabricated platform to measure and manipulate the mechanics of engineered cardiac microtissues. Tissue Engineering Part A. 2011;18:910–919. - PMC - PubMed
    1. Wang G, et al. Modeling the mitochondrial cardiomyopathy of Barth syndrome with induced pluripotent stem cell and heart-on-chip technologies. Nature medicine. 2014;20:616–623. - PMC - PubMed

Publication types

MeSH terms