Predicting the three-dimensional folding of cis-regulatory regions in mammalian genomes using bioinformatic data and polymer models - PubMed Skip to main page content
U.S. flag

An official website of the United States government

Dot gov

The .gov means it’s official.
Federal government websites often end in .gov or .mil. Before sharing sensitive information, make sure you’re on a federal government site.

Https

The site is secure.
The https:// ensures that you are connecting to the official website and that any information you provide is encrypted and transmitted securely.

Access keys NCBI Homepage MyNCBI Homepage Main Content Main Navigation
. 2016 Mar 31:17:59.
doi: 10.1186/s13059-016-0909-0.

Predicting the three-dimensional folding of cis-regulatory regions in mammalian genomes using bioinformatic data and polymer models

Affiliations

Predicting the three-dimensional folding of cis-regulatory regions in mammalian genomes using bioinformatic data and polymer models

Chris A Brackley et al. Genome Biol. .

Abstract

The three-dimensional (3D) organization of chromosomes can be probed using methods like Capture-C. However, it is unclear how such population-level data relate to the organization within a single cell, and the mechanisms leading to the observed interactions are still largely obscure. We present a polymer modeling scheme based on the assumption that chromosome architecture is maintained by protein bridges, which form chromatin loops. To test the model, we perform FISH experiments and compare with Capture-C data. Starting merely from the locations of protein binding sites, our model accurately predicts the experimentally observed chromatin interactions, revealing a population of 3D conformations.

Keywords: Chromosome conformation; Fluorescence in situ hybridization; Polymer model; cis-regulation.


Figures
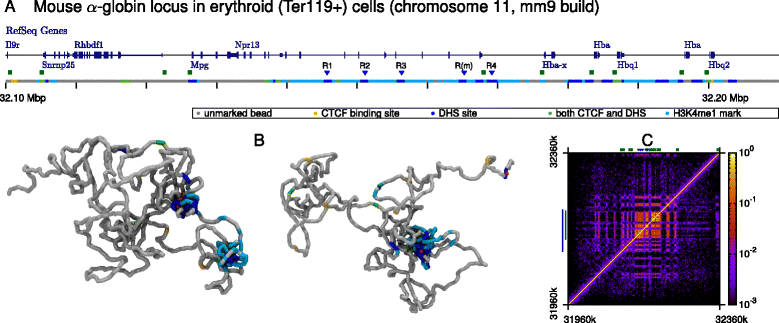
Fig. 1
Fig. 1
Simulating the α globin locus. a Browser view showing genes in the vicinity of the α globin locus, alongside a schematic indicating the coarse-graining used in the simulations. A 110-kbp section of the 400-kbp chromatin fragment that was simulated is shown. As described in the text, simulation chromatin beads were designated as CTCF binding sites, DHS binding, H3K4me1 modified sites and combinations of these. The positions of the set of five regulatory elements are indicated with blue triangles and promoters with green squares. b Example simulated configurations of the locus. CTCF proteins (green) and DHS binding proteins (red) are shown; the chromosome fragment is colored as in (a). See also Additional file 4: Video S1 for a 3D view of the configurations, from which the CTCF proteins are more readily visible. Parameters for the polymer model and the bridge–chromatin affinity are given in full in Additional file 2: Supplementary Methods. c Contact map showing the frequency of contacts between each chromatin bead in 1000 simulated configurations. Note that the color bar shows a logarithmic scale. The blue line to the left indicates the region that is shown in (a). The green line to the left indicates the region that is used for the clustering analysis (Fig. 2 and text)
Fig. 2
Fig. 2
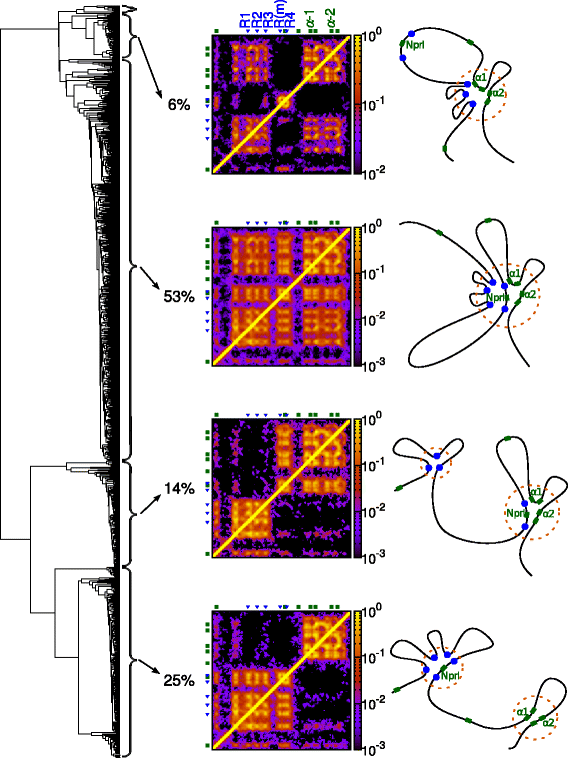
Conformations of the α globin locus can be grouped by similarity. A clustering analysis gives a dendrogram (left), which indicates how similar or different the conformations are. Conformations fall into four main representative structures depending on the pattern of contacts they exhibit (see Additional file 2: Supplementary Methods). Contact maps for each representative structure are shown (center; the region shown is indicated by the green line in Fig. 1 c), as is a schematic of each representative structure (right). The proportion of simulated conformations adopting a given structure gives a prediction of the frequency with which that structure will occur in a population of cells
Fig. 3
Fig. 3
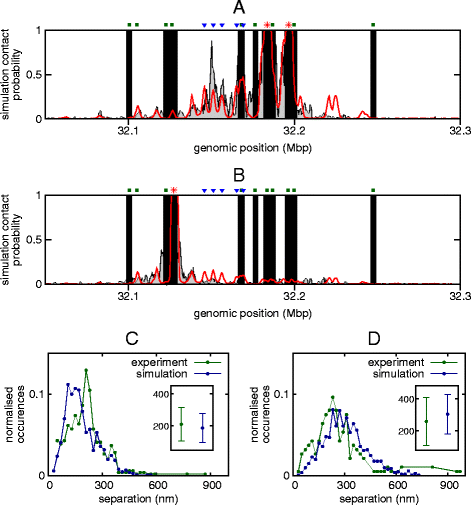
Simulations compare favorably with experimental data. a Plot showing the contacts made with the promoters of the two α globin genes (locations indicated by red asterisks; the positions of the regulatory elements and other gene promoters are also indicated). Simulation results (red) are shown alongside Capture-C data (gray); in both cases the plots show the contacts to both genes combined (since each copy of the gene has the same sequence it is impossible to separate these in the experiment). Black bars indicate regions where there is no contact data (i.e., between captured regions; see Additional file 2: Supplementary Methods and Ref. [14]). Since Capture-C data only give relative contact strength, the height of the experimental data has been scaled so as to best fit the simulation results (see Additional file 2: Supplementary Methods). b As in (a), but now showing the contacts made with the Mpg promoter (position indicated by red asterisk). Although Mpg is roughly the same genomic distance away from the regulatory elements as the α globin genes, it interacts with them less frequently. c Plot showing the distribution of the 3D separation of the α globin promoters and the probe pE located at the regulatory elements R1–3. Simulations are compared with FISH measurements (see Methods and Additional file 7: Figure S5) performed on mature erythroblasts 30 hours after differentiation, when the globin genes are maximally expressed. The inset shows the mean and standard deviation for each case. d As in (c), but showing the separation of the α promoters and a downstream control probe p58 located within the Sh3pxd2b gene
Fig. 4
Fig. 4
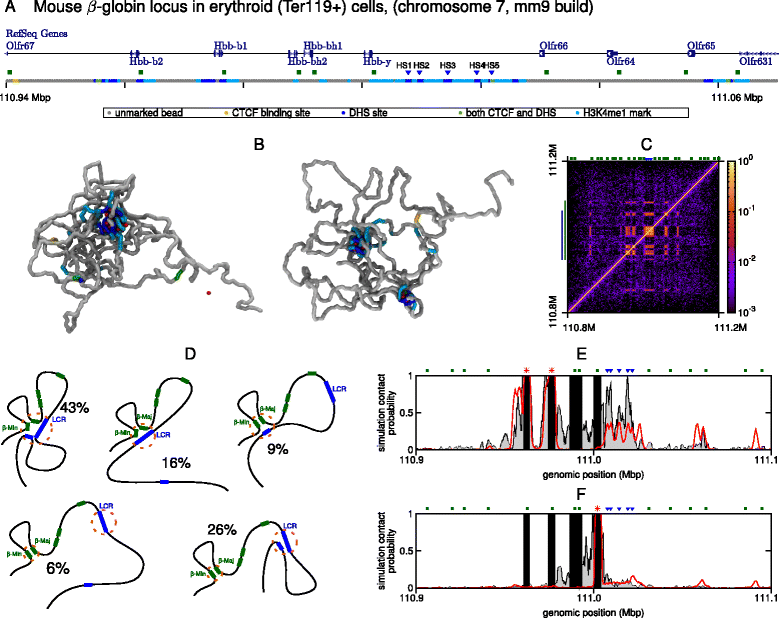
Cis-interactions of the β globin locus. a Browser view showing genes in the vicinity of the β globin locus, alongside a schematic indicating the coarse-graining used in the simulations. A 130-kbp section of the 400-kbp chromatin fragment that was simulated is shown. The positions of the known regulatory elements within the LCR are indicated with blue triangles and promoters with green squares. b Example simulated configurations of the locus. CTCF proteins (green) and DHS binding proteins (red) are shown; the chromosome fragment is colored as in (a). c Contact map showing the frequency of contacts between each chromatin bead in 500 simulated configurations. The color bar shows a logarithmic scale. The blue line to the left indicates the region that is shown in (a); the green line indicates the region that is used in the clustering analysis. d As in Fig. 2, clustering analysis allows conformations to be grouped by their structural features. Schematics of the representative structures are shown, with the percentage of conformations in which they occur. A dendrogram and contact maps for each representative structure are shown in Additional file 10: Figure S8. e Plot showing the contacts made with the promoters of the two β genes (locations indicated by red asterisks; the positions of the regulatory elements and gene promoters are indicated). Simulation results (red) are shown alongside Capture-C data (gray); both cases show the contacts to both genes combined (since each copy of the gene has the same sequence it is impossible to separate these in the experiment). Black bars indicate regions where there is no contact data (see Ref. [14] and Additional file 2: Supplementary Methods). f Similar plot showing the contacts made with the Hbb-y gene (position indicated by red asterisk)
Fig. 5
Fig. 5
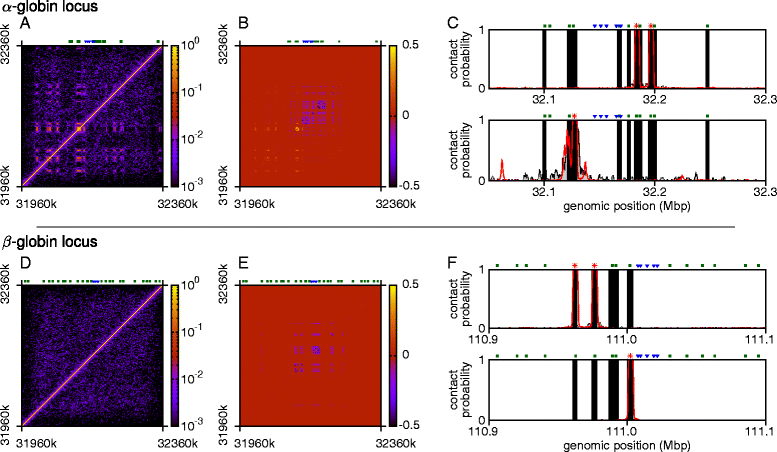
Simulations show changes in locus organization across cell types. a Contact map for 500 conformations for the α globin locus in mES cells. Simulations are performed as in Fig. 1, but using mES cell ChIP-seq and DNase-seq data, as shown in Additional file 11: Figure S9. b Difference between the contact maps in panel (a) and Fig. 1 c. Blue regions indicate contacts that were present in erythroblasts, but not mES cells, and yellow indicates contacts present in mES cells but not erythroblasts. c Plots comparing simulations and Capture-C data for MESs (data from Ref. [14]). df Similar plots but for the β globin locus
Fig. 6
Fig. 6
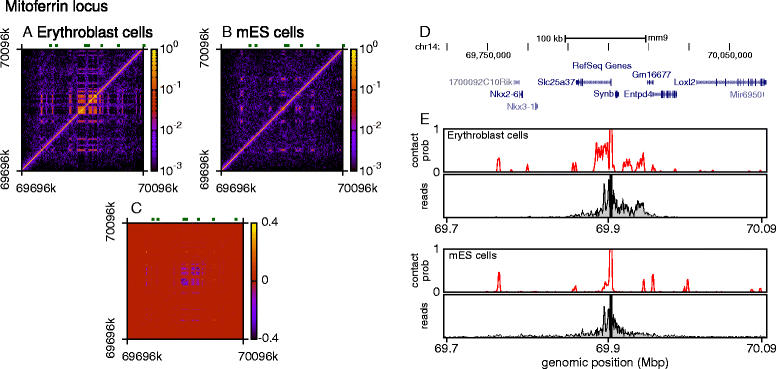
Simulations also correctly predict looping for a less studied locus. Simulations of the Slc25a37 gene (Mitoferrin1) were performed for mouse erythroblasts and embryonic stem cells, using similar input data as for the globin loci (DNase-seq, and ChIP-seq for CTCF and the H3K4me1 histone modification). a Contact map from the simulations of erythroblasts showing the frequency of contacts between each chromatin bead in 500 simulated configurations. b Similar contact map for the same locus in mES cells. c Difference between the contact maps in panels (a) and (b). Blue regions indicate contacts that were present in erythroblasts, but not mES cells, and yellow indicates contacts present in mES cells but not erythroblasts. d Browser view showing the genes across the 400-kb simulated region. e Plots showing the interaction profiles for the Slc25a37 promoter in each cell type, comparing simulation results (upper panels) with new Capture-C data (lower panels). Note that the genomic coordinates are aligned with the browser view in (d)
Fig. 7
Fig. 7
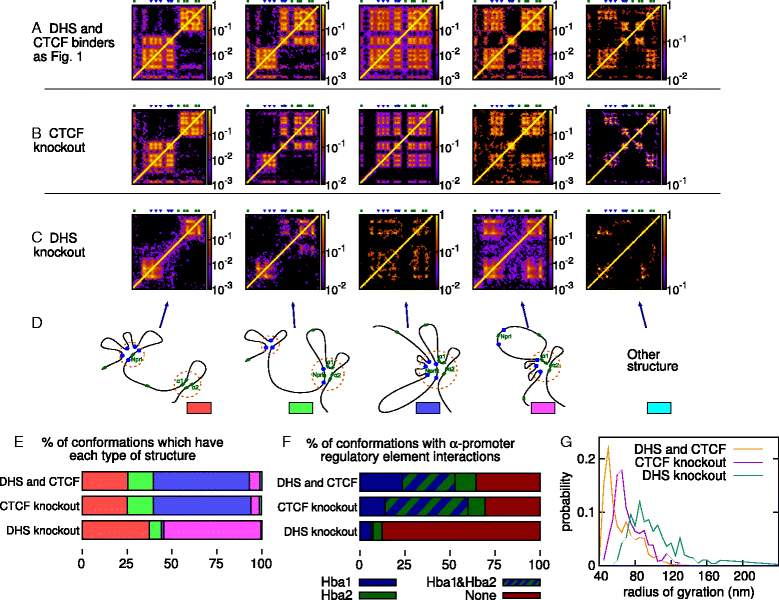
Simulations predict the effect of protein knock-outs in the α globin locus. Plots showing the effect of a CTCF knock-out and a DHS knock-out (equivalent to knocking out all protein complexes involved in looping the α globin locus except CTCF). ac Contact maps showing the interactions between different chromosomal locations for conformations within each group identified by clustering analysis. Maps from three sets of simulations are shown; the positions of the known regulatory elements and gene promoters are indicated above each plot. d Schematics showing the structure of the locus within each group. e Plot showing the percentage of conformations that belong to each group identified by the clustering analysis. The color key is given in (d). f Plot showing in what percentage of conformations the two α globin gene promoters are interacting with one or more of the known regulatory elements. g Plot showing the distribution of the radius of gyration of the locus across the simulated conformations. The radius of gyration is defined as Rg2=(1/N)i=1N(rir¯)2, where r i is the position of the ith chromatin bead in the polymer, and r¯ is the mean position of all N chromatin beads

Similar articles

Cited by

References

    1. Dekker J, Rippe K, Dekker M, Kleckner N. Capturing chromosome conformation. Science. 2002;295(5558):1306–11. doi: 10.1126/science.1067799. - DOI - PubMed
    1. Lieberman-Aiden E, van Berkum NL, Williams L, Imakaev M, Ragoczy T, Telling A, Amit I, Lajoie BR, Sabo PJ, Dorschner MO, Sandstrom R, Bernstein B, Bender MA, Groudine M, Gnirke A, Stamatoyannopoulos J, Mirny LA, Lander ES, Dekker J. Comprehensive mapping of long-range interactions reveals folding principles of the human genome. Science. 2009;326:289–93. doi: 10.1126/science.1181369. - DOI - PMC - PubMed
    1. Dixon JR, Selvaraj S, Yue F, Kim A, Li Y, Shen Y, Hu M, Liu JS, Ren B. Topological domains in mammalian genomes identified by analysis of chromatin interactions. Nature. 2012;485:376–80. doi: 10.1038/nature11082. - DOI - PMC - PubMed
    1. Rao SSP, Huntley MH, Durand NC, Stamenova EK, Bochkov ID, Robinson JT, Sanborn AL, Machol I, Omer AD, Lander ES, Lieberman-Aiden E. A 3D map of the human genome at kilobase resolution reveals principles of chromatin looping. Cell. 2014;159:1665–80. doi: 10.1016/j.cell.2014.11.021. - DOI - PMC - PubMed
    1. Bickmore WA, van Steensel B. Genome architecture: domain organization of interphase chromosomes. Cell. 2013;152:1270–84. doi: 10.1016/j.cell.2013.02.001. - DOI - PubMed

Publication types

LinkOut - more resources