Passive Synaptic Normalization and Input Synchrony-Dependent Amplification of Cortical Feedback in Thalamocortical Neuron Dendrites - PubMed Skip to main page content
U.S. flag

An official website of the United States government

Dot gov

The .gov means it’s official.
Federal government websites often end in .gov or .mil. Before sharing sensitive information, make sure you’re on a federal government site.

Https

The site is secure.
The https:// ensures that you are connecting to the official website and that any information you provide is encrypted and transmitted securely.

Access keys NCBI Homepage MyNCBI Homepage Main Content Main Navigation
. 2016 Mar 30;36(13):3735-54.
doi: 10.1523/JNEUROSCI.3836-15.2016.

Passive Synaptic Normalization and Input Synchrony-Dependent Amplification of Cortical Feedback in Thalamocortical Neuron Dendrites

Affiliations

Passive Synaptic Normalization and Input Synchrony-Dependent Amplification of Cortical Feedback in Thalamocortical Neuron Dendrites

William M Connelly et al. J Neurosci. .

Abstract

Thalamocortical neurons have thousands of synaptic connections from layer VI corticothalamic neurons distributed across their dendritic trees. Although corticothalamic synapses provide significant excitatory input, it remains unknown how different spatial and temporal input patterns are integrated by thalamocortical neurons. Using dendritic recording, 2-photon glutamate uncaging, and computational modeling, we investigated how rat dorsal lateral geniculate nucleus thalamocortical neurons integrate excitatory corticothalamic feedback. We find that unitary corticothalamic inputs produce small somatic EPSPs whose amplitudes are passively normalized and virtually independent of the site of origin within the dendritic tree. Furthermore, uncaging of MNI glutamate reveals that thalamocortical neurons have postsynaptic voltage-dependent mechanisms that can amplify integrated corticothalamic input. These mechanisms, involving NMDA receptors and T-type Ca(2+)channels, require temporally synchronous synaptic activation but not spatially coincident input patterns. In hyperpolarized thalamocortical neurons, T-type Ca(2+)channels produce nonlinear amplification of temporally synchronous inputs, whereas asynchronous inputs are not amplified. At depolarized potentials, the input-output function for synchronous synaptic input is linear but shows enhanced gain due to activity-dependent recruitment of NMDA receptors. Computer simulations reveal that EPSP amplification by T-type Ca(2+)channels and NMDA receptors occurs when synaptic inputs are either clustered onto individual dendrites or when they are distributed throughout the dendritic tree. Consequently, postsynaptic EPSP amplification mechanisms limit the "modulatory" effects of corticothalamic synaptic inputs on thalamocortical neuron membrane potential and allow these synapses to act as synchrony-dependent "drivers" of thalamocortical neuron firing. These complex thalamocortical input-output transformations significantly increase the influence of corticothalamic feedback on sensory information transfer.

Significance statement: Neurons in first-order thalamic nuclei transmit sensory information from the periphery to the cortex. However, the numerically dominant synaptic input to thalamocortical neurons comes from the cortex, which provides a strong, activity-dependent modulatory feedback influence on information flow through the thalamus. Here, we reveal how individual quantal-sized corticothalamic EPSPs propagate within thalamocortical neuron dendrites and how different spatial and temporal input patterns are integrated by these cells. We find that thalamocortical neurons have voltage- and synchrony-dependent postsynaptic mechanisms, involving NMDA receptors and T-type Ca(2+)channels that allow nonlinear amplification of integrated corticothalamic EPSPs. These mechanisms significantly increase the responsiveness of thalamocortical neurons to cortical excitatory input and broaden the "modulatory" influence exerted by corticothalamic synapses.

Keywords: NMDA receptor; T-type calcium channel; dendritic integration; passive normalization; thalamocortical.


Figures

Figure 1.
Figure 1.
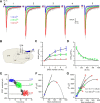
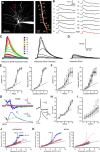
Variance-mean analysis of CT EPSC quantal size. A, Trains (10 Hz) of evoked CT EPSCs in a representative dLGN TC neuron under varying extracellular Ca2+ concentrations. Blue traces represent mean EPSC 1 mm Ca2+. Green traces represent mean EPSC 2 mm Ca2+. Red traces represent mean EPSC 5 mm Ca2+. Gray traces represent individual EPSCs. B, Schematic of slice preparation showing placement of stimulating and recording electrodes. C, EPSC frequency-dependent facilitation typical of CT EPSCs. D, Time-dependent recovery of CT EPSCs from facilitation (n = 6). E, A typical experiment (traces shown in A) used for VM analysis of quantal size. Same colors as in A. At each Ca2+ concentration, 40–50 evoked EPSCs were collected. The increase in mean EPSC amplitude is accompanied by an increase of the variance of the response with increasing Ca2+ concentration. F, Plot of mean EPSC amplitude versus EPSC amplitude variance (σ2) for 50 trials at different Ca2+ concentrations. Same colors as in A. A second-order polynomial (quadratic) fit of the data yields a quantal size (Q, initial slope) of 10.7 ± 2.0 pA. G, Overlaid individual fits to data from 11 dLGN TC neurons. Mean values for Q and release probability in 2 mm Ca2+ (Pr 2 mm Ca2+) are shown.
Figure 2.
Figure 2.
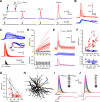
Attenuation and passive normalization of CT EPSPs in TC neuron dendrites. A, Somatic (blue) and dendritic (red) aEPSPs evoked by aEPSC injections (40 pA, black) at increasing distance from the soma in four different TC neurons. B, Overlaid somatic (blue) and dendritic (red) aEPSPs shown in A. Note the marked similarity in somatic aEPSP amplitude, rise time, and decay. C, Traces represent the linear increase in dendritic (red) and somatic (blue) aEPSPs amplitude evoked by increasing-sized aEPSCs (10–100 pA). Inset, Overlaid and peak normalized somatic and dendritic EPSPs have the same rise and decay times. D, Individual (light red) and average (red) dendritic aEPSP amplitude and corresponding individual (light blue) and average (blue) somatic aEPSP amplitude plotted against injected aEPSC size. Bottom graph represents D→S aEPSP attenuation independent of the size of injected aEPSCs. E, Individual (light red) and average (red) dendritic sEPSPs and corresponding individual (light blue) and average (blue) somatic sEPSPs recorded 72 μm from the soma. F, EPSP amplitude versus distance from soma. aEPSPs were evoked by quantal-sized (10 pA) aEPSC injections. Red circles represent dendritic aEPSP. Blue circles represent somatic aEPSP. Red filled triangles represent dendritic sEPSP. Blue filled triangles represent somatic sEPSP. Gray lines indicate data from four model dendrites. Bottom graph represents an expanded view of the peak somatic aEPSP (blue circles) and sEPSP (blue filled triangles) amplitude versus distance of the dendritic current injection from the soma. G, EPSP attenuation in TC neuron dendrites. Red circles represent aEPSPs. Red filled triangles represent sEPSPs. Gray lines indicate model EPSPs. Black dashed line indicates steady-state VD→VS. H, Model cell showing dendritic locations into which EPSC-like currents shown in I and J were injected. I, Input location-dependent model EPSPs. Color-coded dendritic and somatic EPSPs evoked by EPSC injection into the sites shown in H. J, Propagation of distal EPSPs in model dendrites. EPSPs recorded at each location in H in response to an EPSC injected at the most distal site.
Figure 3.
Figure 3.
Temporal window for optimal compound CT-EPSP propagation. A, Somatic (blue) and dendritic (red) compound aEPSPs evoked by trains of five injected aEPSCs (black) at varying inter-EPSC intervals (0.1–100 ms). B, Example traces showing somatic and dendritic responses evoked by EPSC trains at 0.1 and 10 ms intervals. Bottom traces represent somatic compound aEPSPs scaled to match the peak dendritic aEPSP at 0.1 ms. The reduced attenuation between aEPSPs with 0.1 and 10 ms intervals for the somatic (blue) versus dendritic (red) recording site is clear. C, Propagation of model compound EPSPs recorded at the locations shown in response to EPSCs evoked at the most distal location (10 ms interval). D, Compound aEPSP amplitude normalized to the amplitude at 0.1 ms intervals versus inter-EPSC interval. Blue circles represent somatic compound aEPSPs. Red circles represent dendritic compound aEPSPs. Gray circles represent model dendritic compound aEPSPs. Gray squares represent model somatic compound aEPSPs. E, Attenuation of compound aEPSPs versus inter-EPSC frequency. Black circles represent experimental data. Gray circles represent model.
Figure 4.
Figure 4.
Control experiments for 2-photon glutamate uncaging. A, Pseudocolor image of a 0.17 μm PS-speck fluorescent microsphere revealing the axial (X-Z) imaging (810 nm) point-spread function (PSF) of our microscope fitted with 60×, 1.0 NA objective lens (Olympus LUMPlan FL/N). B, Lateral (X) PSF. Gray circles represent normalized fluorescence intensity for individual microspheres. Red line indicates average intensity. Black dashed line indicates theoretical diffraction-limited PSF (see Zipfel et al., 2003; and Materials and Methods). C, Axial (Z) PSF. Gray circles represent normalized fluorescence intensity for individual microspheres. Blue line indicates average intensity. Black dashed line indicates theoretical diffraction-limited PSF. D, Lateral diffusional influence of uncaged glutamate. uEPSPs evoked by glutamate uncaging onto dendritic spines of a CA1 hippocampal pyramidal neuron basal dendrite (red spots). Progressively moving the uncaging spot further (1 μm increments) from the spine head caused reduction, then loss of evoked uEPSPs (green circles). E, Plot of normalized uEPSP versus distance from spine head (0 μm, maximal response). F, Typical glutamate uncaging evoked EPSC from a distal TC neuron dendrite (average of 20 individual events) and a synaptically evoked EPSC at −50 mV. Black traces represent control. Blue traces represent AMPA EPSC (in 50 μm d-AP5). Red traces represent NMDA EPSC (Control-AMPA EPSC). G, NMDA-to-AMPA ratio for uEPSP and synaptically evoked EPSP (p > 0.05, n = 5).
Figure 5.
Figure 5.
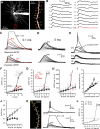
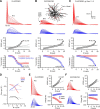
Synchrony-dependent nonlinear amplification of corticothalamic synaptic input to hyperpolarized thalamocortical neurons. A, Two-photon fluorescence image of a TC neuron showing the location of glutamate uncaging spots. Area bounded by red box is shown enlarged (right). B, Individual uEPSPs evoked by glutamate uncaging at the numbered spots indicated in A with 400 ms interspot intervals. C, Example traces represent responses to increasing numbers of uncaging spots (0.1 ms interval) delivered to the dendrite shown in A. Bottom traces represent the expected sum of the individual uEPSPs in B. D, Same as in C but for interspot interval of 5 ms. E, Trial-to-trial variability of uEPSPs with increasing numbers of inputs (0.1 ms, #8–12) near LTS threshold. Note the occurrence of varying degrees of uEPSP amplification and LTSs with equal input numbers (#12). F, uEPSP amplitude versus number of uncaging inputs delivered. Gray circles represent individual uEPSPs (0.1 ms interval, n = 5 trials per dendrite per input number, 11 neurons) illustrating trial-to-trial variability depicted in E. Filled gray circles represent individual uEPSPs (5 ms intervals, 5 trials per dendrite per input number, 6 neurons). Black circles represent mean uEPSPs (0.1 ms). Filled red circles represent mean uEPSP excluding LTSs. Dashed black line indicates linear fit to mean uEPSPs evoked by 2–6 inputs. Filled black circles represent mean uEPSP with 5 ms interval. G, LTS threshold-aligned uEPSPs versus number of inputs delivered. Same symbols as in F. Red circles represent the amplified uEPSPs shown in inset. H, uEPSP area versus number of inputs delivered. Same symbols as in F. Red circles represent the uEPSPs shown in inset (G). I, Measured sub-LTS threshold uEPSPs versus expected arithmetic sum of individual uEPSPs. J, Maximum rate of rise (δV/δt) for sub-LTS threshold uEPSPs at 0.1 ms (black circles) and 5 ms (filled black circles) intervals. K, Two-photon fluorescence image showing the distributed location of glutamate uncaging spots. Traces represent uEPSPs evoked by uncaging inputs distributed (∼60 μm) over a single dendritic branch. L, Plot of the mean, threshold-aligned I-O function for inputs delivered to single dendritic branches in clustered (∼30 μm, black circles) or distributed (∼60 μm) patterns.
Figure 6.
Figure 6.
Simulated synchrony-dependent nonlinear EPSP amplification with quantal-sized CT inputs. A, Simulated somatic and dendritic responses to increasing numbers of synchronous (0.1 ms) and asynchronous (5 ms) uEPSP-sized model inputs. The dendritic input and recording location is indicated by the red circle overlaid onto a 2-dimensional projection of the model TC neuron. B, Measured EPSPs evoked by increasing numbers of inputs versus the expected sum of individual simulated EPSPs for each temporal input pattern. Red traces represent the maximum measured subthreshold response and the equivalent expected EPSP with the same number of inputs. C, The I-O function for simulated EPSPs delivered at 0.1 ms (black circles) and 5 ms (filled black circles) intervals. The individual experimental trials (gray circles) and the mean uEPSPs, excluding LTSs (filled red circles) as described in Figure 1, are shown for comparison. D, Threshold-aligned I-O function of simulated (gray) and experimental (black) EPSPs for each different temporal input pattern. E, I-O function for simulated EPSPs evoked by uncaging sized inputs (black circles) and quantal-sized inputs (filled gray diamonds). Note the increased number of inputs required to evoke nonlinear responses with smaller EPSPs but equivalent voltage threshold for the nonlinearity. F, Measured EPSPs versus expected EPSPs for uncaging sized (black circles) and quantal-sized (filled gray diamonds) inputs reveal similar I-O functions. Red line indicates EPSPs evoked by quantal size inputs delivered at 0.24 ms intervals to match the δV/δt obtained with uncaging sized inputs and allow all input to be delivered in the equivalent temporal window (9.5 ms). This reduces the threshold number of quantal-sized inputs to evoke LTSs from 38 to 31 inputs.
Figure 7.
Figure 7.
Mechanism of nonlinear corticothalamic EPSP amplification in hyperpolarized TC neurons. A, Traces represent synchronous (0.1 ms) uncaging evoked EPSPs in the presence of TTX at −70 mV. Filled green circles represent threshold-aligned uEPSPs versus input number in TTX (0.5 μm). Black circles represent control. B, Same as in A for TTA-P2 (filled purple circles, 5 μm). C, Same as in A for d-AP5 (filled orange circles, 50 μm). D, Traces represent simulated synchronous EPSPs in the absence of Na+ conductance. Filled green circles represent EPSPs with gNa = 0. Black circles represent control. E, Same as in D for zero T-type Ca2+ channel conductance (gT = 0, filled purple circles). F, Same as in D for zero NMDA receptor conductance (gNMDA = 0, filled orange circles).
Figure 8.
Figure 8.
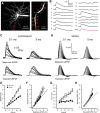
Synchrony-dependent enhanced I-O gain in depolarized thalamocortical neurons. A, Two-photon fluorescence image of a TC neuron showing the location of glutamate uncaging spots. Area bounded by red box is shown enlarged (right). B, Individual uEPSPs evoked by glutamate uncaging at the numbered spots indicated in A with 400 ms interspot intervals. C, Example traces depicting uEPSP responses to increasing numbers of uncaging spots at 0.1 and 5 ms intervals delivered to the dendrite shown in A. Bottom traces represent the expected sum of the individual uEPSPs for each temporal input pattern. D, Same as in C for simulated EPSPs. E, Mean uEPSPs versus number of inputs for 0.1 ms (black circles) and 5 ms (filled black circles) intervals at −55 mV. F, Measured uEPSP versus expected uEPSP at −55 mV. Symbols as in E. G, δV/δt of uEPSPs at −55 mV versus number of inputs. Symbols as in E. H, Simulated measured EPSP versus expected EPSP at −55 mV. Symbols as in E.
Figure 9.
Figure 9.
Mechanism of postsynaptic I-O gain enhancement in depolarized thalamocortical neurons. A, Traces represent uEPSPs evoked by synchronous (0.1 ms) glutmate uncaging in the presence of TTX (0.5 μm) and the expected sums of individual uEPSPs from the same dendrite. B, Same as in A for TTA-P2 (5 μm). C, Same as in A for d-AP5 (50 μm). D, Mean measured versus expected uEPSPs for synchronous inputs. Filled green circles represent TTX. Dashed green line indicates linear fit to mean uEPSPs in TTX. Filled purple circles represent TTA-P2. Dashed purple line indicates linear fit to mean uEPSPs in TTA-P2. Filled orange circles represent d-AP5. Dashed orange line indicates linear fit to mean uEPSPs in d-AP5. Black circles represent control. Dashed black line indicates unity. E, Histogram summarizing I-O gain under different tested conditions. F, Same as in D for simulated EPSPs at −55 mV. G, Graph representing contribution of ITwindow to single simulated EPSPs. Black circles represent simulated single spot EPSP amplitude at different resting membrane potentials (RMP). Purple circles represent T-type Ca2+ channel contribution to individual EPSPs at different resting membrane potentials. Solid gray line indicates steady-state inactivation curve for model T-type Ca2+ channels. Dashed gray line indicates steady-state activation curve for model T-type Ca2+ channels.
Figure 10.
Figure 10.
Overlapping EPSP amplification mechanisms enhance the voltage response range of thalamocortical neurons. A, Two-photon fluorescence image of a TC neuron showing the location of glutamate uncaging spots. Area bounded by red box is shown enlarged (right). B, Individual uEPSPs evoked by glutamate uncaging at the numbered spots indicated in A with 400 ms interspot intervals. C, Example traces represent uEPSP from individual trials (5 trials per input number) evoked by delivering increasing numbers of uncaging spots to the dendrite depicted in A at 0.1 ms intervals. Traces are color coded for the number of inputs delivered as shown inset. Black traces represent average uEPSP evoked by each number of inputs. D, Expected sum of individual inputs shown in B. E, uEPSP amplitude versus number of inputs delivered and the measured versus expected uEPSPs for the dendrite shown in A. Gray circles represent individual trial uEPSPs. Black circles represent mean uEPSP. Dashed black line indicates unity. F, Same as in E for all trials in every neuron tested. G, Voltage responses in the cell shown in A evoked by 6, 10, and 16 uncaging inputs and their first temporal derivatives (δV/δt). A clear inflection in the δV/δt and voltage traces indicates the initiation of a “weak” LTS by the maximum number of inputs (as indicated by arrows). For comparison, the δV/δt for a full LTS evoked by 16 inputs at −70 mV (in TTX) is shown (black traces). H, δV/δt versus number of inputs for the dendrite shown in A. Same symbols as in E. Dashed black line indicates linear fit to uEPSPs evoked by 2–6 inputs. I, δV/δt versus number of inputs for all trials in every neuron tested. Same symbols as in E. A step-like nonlinear increase in δV/δt is observed with 12–16 uncaging inputs as a consequence of “weak” LTS initiation. J, Experimental data showing measured versus expected uEPSPs at −70 mV (black circles), −60 mV (filled blue circles), and −55 mV (filled red circles). Dashed black line indicates unity. K, Left, Control simulated measured versus expected EPSPs at the membrane potentials described for the experimental data shown in J. Same symbols as in J. Right, Simulated measured versus expected EPSPs in the absence of T-type Ca2+ channels. Circles represent EPSPs (gT = 0). Dotted lines indicate EPSPs control. Same colors as in J.
Figure 11.
Figure 11.
Spatially distributed synchronous corticothalamic EPSPs are amplified by T-type Ca2+ channel and NMDA receptor-dependent mechanisms. A, Dendritic (red) and somatic (blue) EPSPs generated by increasing numbers of spatially clustered inputs onto a distal dendrite of our computational model at Vm: −70 mV (Dend 1 in B). EPSPs are amplified in a nonlinear manner before reaching LTS threshold at 13 inputs (#13 LTS). In the clustered input case, nonlinear EPSP amplification is due to the local dendritic recruitment of T-type Ca2+ channels by large dendritic EPSPs. Below LTS threshold, the T-type Ca2+ current generated locally in Dend 1 represents the majority of the T-type Ca2+ current in the whole cell. B, Somatic and dendritic EPSPs evoked by spatially distributed synaptic input. Red dots superimposed onto the image of our model cell represent the input locations for the distributed synaptic input. Spatial input patterns were randomly generated, but each input site was used only once per input sequence (the number of possible input locations is greater than the number of inputs delivered). The larger local dendritic EPSP with input into Dend 1 where the dendritic voltage was recorded. In the distributed input case, 19 inputs were required to produce an LTS compared with 13 in the clustered case. Because of the smaller dendritic depolarization, T-type Ca2+ current currents in individual dendrites are markedly reduced with distributed input. C, Traces represent the somatic and dendritic response to the clustered input pattern after removal of T-type Ca2+ channels from Dend 1 only. In the absence of dendritic T-type Ca2+ channels in the stimulated dendrite, EPSP summation and amplification are almost identical to the distributed input case. D, Differential contribution of AMPA and NMDA receptors to EPSP with clustered and distributed input. Blue lines indicate charge input to the neuron via AMPA receptors. Red lines indicate charge through NMDA receptors. Black lines indicate total charge for increasing numbers of inputs. Solid lines indicate the clustered input case. Dashed lines indicate distributed input. E, Somatic and dendritic responses to clustered synaptic input at −55 mV. Enhanced I-O gain occurs as a consequence of markedly increasing contribution of NMDA receptors with increasing input numbers. F, Responses to dendritically distributed inputs at −55 mV. I-O gain is similar to the clustered case despite a much smaller increase in NMDA receptor charge with increasing inputs due to the relative lack of decrease in AMPA receptor-mediated component.
Figure 12.
Figure 12.
Nonlinear mechanisms limit the magnitude of subthreshold membrane potential modulation. A, Schematic representation of the computer simulation. Timing of EPSPs was determined by sampling from a Poisson distribution, and the spatial location of the synaptic input was chosen randomly from a set of inputs on the distal dendrites. Simulations were run repeatedly over a range of mean interevent intervals, and the rate of input was increased until the cell spiked on >50% of trials. Simulations were run at different resting potentials, and in the presence or absence of nonlinear mechanisms (NMDA receptors and T-type Ca2+ channels). During the simulation run, the membrane potential during the last 500 ms of the input train was averaged. B, The result of the simulation showing that across a range of membrane potentials, the maximum subthreshold depolarization reached during input trains was significantly higher when nonlinear mechanisms were removed (p < 0.0001). C, Example waveforms showing the voltage response of neurons at different membrane potentials to random trains of input at frequencies just below that needed to cause spiking (subthreshold), and just above it (suprathreshold). Action potentials are truncated for clarity.

Similar articles

Cited by

References

    1. Abrahamsson T, Cathala L, Matsui K, Shigemoto R, Digregorio DA. Thin dendrites of cerebellar interneurons confer sublinear synaptic integration and a gradient of short term plasticity. Neuron. 2012;73:1159–1172. doi: 10.1016/j.neuron.2012.01.027. - DOI - PubMed
    1. Augustinaite S, Kuhn B, Helm PJ, Heggelund P. NMDA spike/plateau potentials in dendrites of thalamocortical neurons. J Neurosci. 2014;34:10892–10905. doi: 10.1523/JNEUROSCI.1205-13.2014. - DOI - PMC - PubMed
    1. Béhuret S, Deleuze C, Gomez L, Frégnac Y, Bal T. Cortically-controlled population stochastic facilitation as a plausible substrate for guiding sensory transfer across the thalamic gateway. PLoS Comput Biol. 2013;9:e1003401. doi: 10.1371/journal.pcbi.1003401. - DOI - PMC - PubMed
    1. Branco T, Häusser M. Synaptic integration gradients in single cortical pyramidal cell dendrites. Neuron. 2011;69:885–892. doi: 10.1016/j.neuron.2011.02.006. - DOI - PMC - PubMed
    1. Branco T, Clark BA, Häusser M. Dendritic discrimination of temporal input sequences in cortical neurons. Science. 2010;329:1671–1675. doi: 10.1126/science.1189664. - DOI - PMC - PubMed

Publication types

MeSH terms

LinkOut - more resources