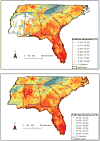
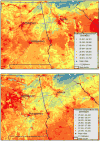
Estimating daily air temperature across the Southeastern United States using high-resolution satellite data: A statistical modeling study
- PMID: 26717080
- PMCID: PMC4761507
- DOI: 10.1016/j.envres.2015.12.006
Estimating daily air temperature across the Southeastern United States using high-resolution satellite data: A statistical modeling study
Abstract
Accurate estimates of spatio-temporal resolved near-surface air temperature (Ta) are crucial for environmental epidemiological studies. However, values of Ta are conventionally obtained from weather stations, which have limited spatial coverage. Satellite surface temperature (Ts) measurements offer the possibility of local exposure estimates across large domains. The Southeastern United States has different climatic conditions, more small water bodies and wetlands, and greater humidity in contrast to other regions, which add to the challenge of modeling air temperature. In this study, we incorporated satellite Ts to estimate high resolution (1km×1km) daily Ta across the southeastern USA for 2000-2014. We calibrated Ts-Ta measurements using mixed linear models, land use, and separate slopes for each day. A high out-of-sample cross-validated R(2) of 0.952 indicated excellent model performance. When satellite Ts were unavailable, linear regression on nearby monitors and spatio-temporal smoothing was used to estimate Ta. The daily Ta estimations were compared to the NASA's Modern-Era Retrospective Analysis for Research and Applications (MERRA) model. A good agreement with an R(2) of 0.969 and a mean squared prediction error (RMSPE) of 1.376°C was achieved. Our results demonstrate that Ta can be reliably predicted using this Ts-based prediction model, even in a large geographical area with topography and weather patterns varying considerably.
Keywords: Air temperature; Exposure error; MODIS; Reanalysis; Surface temperature.
Copyright © 2015 Elsevier Inc. All rights reserved.
Conflict of interest statement
Figures


Similar articles
-
A spatiotemporal reconstruction of daily ambient temperature using satellite data in the Megalopolis of Central Mexico from 2003 to 2019.Int J Climatol. 2021 Jun 30;41(8):4095-4111. doi: 10.1002/joc.7060. Epub 2021 Mar 18. Int J Climatol. 2021. PMID: 34248276 Free PMC article.
-
Estimating daily minimum, maximum, and mean near surface air temperature using hybrid satellite models across Israel.Environ Res. 2017 Nov;159:297-312. doi: 10.1016/j.envres.2017.08.017. Epub 2017 Aug 21. Environ Res. 2017. PMID: 28837902
-
Temporal and spatial assessments of minimum air temperature using satellite surface temperature measurements in Massachusetts, USA.Sci Total Environ. 2012 Aug 15;432:85-92. doi: 10.1016/j.scitotenv.2012.05.095. Epub 2012 Jun 20. Sci Total Environ. 2012. PMID: 22721687 Free PMC article.
-
Assessment and statistical modeling of the relationship between remotely sensed aerosol optical depth and PM2.5 in the eastern United States.Res Rep Health Eff Inst. 2012 May;(167):5-83; discussion 85-91. Res Rep Health Eff Inst. 2012. PMID: 22838153
-
Satellite remote sensing in epidemiological studies.Curr Opin Pediatr. 2016 Apr;28(2):228-34. doi: 10.1097/MOP.0000000000000326. Curr Opin Pediatr. 2016. PMID: 26859287 Free PMC article. Review.
Cited by
-
Chronic effects of temperature on mortality in the Southeastern USA using satellite-based exposure metrics.Sci Rep. 2016 Jul 20;6:30161. doi: 10.1038/srep30161. Sci Rep. 2016. PMID: 27436237 Free PMC article.
-
Using geographic effect measure modification to examine socioeconomic-related surface temperature disparities in New York City.J Expo Sci Environ Epidemiol. 2024 Aug 23. doi: 10.1038/s41370-024-00714-6. Online ahead of print. J Expo Sci Environ Epidemiol. 2024. PMID: 39179752
-
An improved machine learning-based model for prediction of diurnal and spatially continuous near surface air temperature.Sci Rep. 2024 Nov 9;14(1):27342. doi: 10.1038/s41598-024-78349-8. Sci Rep. 2024. PMID: 39521866 Free PMC article.
-
Diarrhea Patterns and Climate: A Spatiotemporal Bayesian Hierarchical Analysis of Diarrheal Disease in Afghanistan.Am J Trop Med Hyg. 2019 Sep;101(3):525-533. doi: 10.4269/ajtmh.18-0735. Am J Trop Med Hyg. 2019. PMID: 31392940 Free PMC article.
-
A spatiotemporal reconstruction of daily ambient temperature using satellite data in the Megalopolis of Central Mexico from 2003 to 2019.Int J Climatol. 2021 Jun 30;41(8):4095-4111. doi: 10.1002/joc.7060. Epub 2021 Mar 18. Int J Climatol. 2021. PMID: 34248276 Free PMC article.
References
-
- Gosling SN, Lowe JA, McGregor GR, Pelling M, Malamud BD. Associations between elevated atmospheric temperature and human mortality: a critical review of the literature. Climatic Change. 2009;92(3-4):299–341.
-
- Gosling SN, McGregor GR, Lowe JA. Climate change and heat-related mortality in six cities Part 2: climate model evaluation and projected impacts from changes in the mean and variability of temperature with climate change. International journal of biometeorology. 2009;53(1):31–51. - PubMed
Publication types
MeSH terms
Grants and funding
LinkOut - more resources
Full Text Sources
Other Literature Sources

