An algorithm to predict the connectome of neural microcircuits - PubMed Skip to main page content
U.S. flag

An official website of the United States government

Dot gov

The .gov means it’s official.
Federal government websites often end in .gov or .mil. Before sharing sensitive information, make sure you’re on a federal government site.

Https

The site is secure.
The https:// ensures that you are connecting to the official website and that any information you provide is encrypted and transmitted securely.

Access keys NCBI Homepage MyNCBI Homepage Main Content Main Navigation
. 2015 Oct 8:9:120.
doi: 10.3389/fncom.2015.00120. eCollection 2015.

An algorithm to predict the connectome of neural microcircuits

Affiliations

An algorithm to predict the connectome of neural microcircuits

Michael W Reimann et al. Front Comput Neurosci. .

Abstract

Experimentally mapping synaptic connections, in terms of the numbers and locations of their synapses and estimating connection probabilities, is still not a tractable task, even for small volumes of tissue. In fact, the six layers of the neocortex contain thousands of unique types of synaptic connections between the many different types of neurons, of which only a handful have been characterized experimentally. Here we present a theoretical framework and a data-driven algorithmic strategy to digitally reconstruct the complete synaptic connectivity between the different types of neurons in a small well-defined volume of tissue-the micro-scale connectome of a neural microcircuit. By enforcing a set of established principles of synaptic connectivity, and leveraging interdependencies between fundamental properties of neural microcircuits to constrain the reconstructed connectivity, the algorithm yields three parameters per connection type that predict the anatomy of all types of biologically viable synaptic connections. The predictions reproduce a spectrum of experimental data on synaptic connectivity not used by the algorithm. We conclude that an algorithmic approach to the connectome can serve as a tool to accelerate experimental mapping, indicating the minimal dataset required to make useful predictions, identifying the datasets required to improve their accuracy, testing the feasibility of experimental measurements, and making it possible to test hypotheses of synaptic connectivity.

Keywords: algorithm development; connectome mapping; cortical circuits; in silico; neocortex; somatosensory cortex; synaptic transmission.


Figures
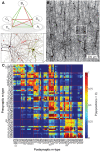
Figure 1
Figure 1
A connectome selected from incidental appositions is constrained by connectivity measures and circuit parameters. (A) Logical dependencies between connectivity metrics in a pathway. Green edges indicate that when one metric increases, the other also increases, provided the rest remains unchanged, vice versa for red. Metrics are: Bouton density (Bd), connection probability (Cp), mean number of synapses per connection (Sm), cell density (Cd) and axonal length (Al). (B) Part of the unitary microcircuit after all morphologies are placed (5% cell density shown). The resulting high density of fibers leads to a myriad of pairwise morphological appositions. Magnification: Example of a pair of morphologies with all 12 axonal appositions between them highlighted. (C) Resulting connection probabilities for neuron pairs within 100 μm of each other (horizontal distance between somas) in all types of pathways, if a synapse was placed at every single apposition.
Figure 2
Figure 2
Validation of volumetric dendrite densities. (A) Fraction of the volume occupied by dendrites in a reconstructed microcircuit, surrounded by neighboring microcircuits on six sides. Contributions from cells residing in different layers are indicated by different shades of blue. Contributions from the surrounding microcircuits are stacked in different shades of green. Red solid horizontal lines indicate biological volume fractions in hippocampus (Mishchenko et al., 2010). (B) Distribution of diameters of basal dendrites of L5_TTPCs. Blue bars: reconstruction for (dark) terminal and (light) intermediate segments, squares and dashed lines indicate the mean; red circles: mean values for P14 of Romand et al. (2011).
Figure 3
Figure 3
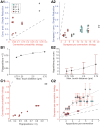
Simple approaches to filtering of potential synapses do not reproduce biological connectivity. (A) Comparing the results of a simple random pruning of potential synapses to biological data: Potential synapses were removed with a uniform, independent probability, otherwise an actual synapse is allowed to form. (A1) Resulting connection probabilities, (A2) resulting mean number of synapses per connection (maximal distance 100 μm). Markers indicate the type of pathway, red triangle: excitatory, blue semicircle: inhibitory. Left side indicates the type of the presynaptic m-type, right side indicates the postsynaptic m-type. Gray, dashed line indicates the identity (x = y). (B) Connection probability (B1) and synapse numbers (B2) in a network of L5_TTPC2 neurons (maximal distance 100 μm) based on potential synapses when the maximal reach of potential synapses is changed. Bars indicate means, error bars standard deviations. (C) Comparing connectivity based on all potential synapses to biological data. (C1) Resulting connection probabilities, and (C2) mean number of potential synapses per connection. Markers and gray line as in (A). Black, dashed lines indicate the fits used to predict the mean number of synapses.
Figure 4
Figure 4
Schematic of the three pruning steps. For an exemplary pathway (L5_TTPC2 to L5_TTPC2), we show how the distributions of inter-bouton intervals (IBI, inverse of bouton density), synapses per connection and connection probability are matched after three pruning steps. (A) Connectivity based on all potential synapses (i.e., appositions) is characterized by short IBIs, an extremely wide distribution of potential synapses per connection, and almost 100% connection probability. Top: An exemplary L4_PC surrounded by 3 LBCs with all potential synapses highlighted. (B) Randomly removing a fraction (1−f1) of potential synapses removes the right hand side of the distribution of synapses per connection. Top: This removes a fraction of potential synapses in all three connections. (C) Removing connections formed by too few potential synapses also culls the left hand side, but inter-bouton intervals are still too short. Top: The panel shows the removal of one complete connection that does not have the required number of potential synapses. (D) The last step randomly removes more connections, leading to correct inter-bouton-intervals and connection probabilities only slightly below reported values emerge. Top: One of the two remaining connections is (randomly) removed.
Figure 5
Figure 5
Biological synapse numbers and bouton densities recreated for different touch distances. (A) Resulting mean number of synapses per connection in pathways, where available biological data on mean and standard deviation of synapse numbers as well as bouton densities are used to fully constrain algorithm parameters. Results for different values of the maximal reach of potential synapses (touch distance): Stars: 0.75 μm; triangles: 1.25 μm; diamonds: 2.5 μm; circles: 3.75 μm. Mean values compared to biological values in Table 1. (B) Same for the bouton densities of individual m-types. Mean values compared to biological values in Table 3. (C) Box-plots of the parameter values determined by the biological parameterization procedure for inhibitory to excitatory (IE), excitatory to inhibitory (EI), inhibitory to inhibitory (II), and excitatory to excitatory (EE) pathways and different touch distances (left to right). Markers indicate the median, thick lines the 25 and 75% percentiles and thin lines the full data spread.
Figure 6
Figure 6
Validation of the Predicted Connectivity. Results emerging from the biological parametrization: (A) Comparison of the resulting mean number of synapses per connection to biology. Markers indicate the type of pathway as in Figure 3. (B) Comparison of bouton densities of a number of m-types to biology. Purple squares: mean densities, red error bar: standard error of mean (SEM) of biological data, blue error bar: SEM of model data. (C) Comparison of the mean connection probabilities in the model against biological data. Squares indicate connection probabilities of all cells within 100 μm, diamonds connection probabilities resulting from an in silico patch experiment (see Methods).
Figure 7
Figure 7
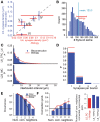
Validation of emergent properties. (A) Volumetric density of inhibitory synapses at the centers of the layers compared to measurements from electron microscopy. Purple circles indicate means, red lines the SD of the EM data (DeFelipe, personal communication), blue lines the SD of the reconstruction. (B) Distribution of the number of inhibitory synapses on the somas of L5_TTPC1 and L5_TTPC2 cells. Red bar: experimental data (DeFelipe, personal communication). (C) Distribution of intervals between efferent synapses in the model (blue bars) and biological inter-bouton intervals (red lines) for two m-types. Biological data from (Karube et al., 2004) (L23_MC) and (Anderson et al., 2002) (L6_PC). (D) Distribution of the number of synapses per bouton under the assumption that efferent synapses with an unbiologically low interval between them (<1 μm) were formed by the same bouton. Red lines: Data from (Bopp et al., , mouse) and (DeFelipe, personal communication). (E) Distribution of the number of common neighbors of pairs of L5_TTPCs. Blue bars: Data from the reconstructed connectome obtained in an in silico patch experiment (see Methods). Red line: Data from (Perin et al., 2011). Black line: Data expected in a network with uniformly and independently random connectivity. (F) Left: Unidirectional connection probability between L5_TTPCs with different numbers of common neighbors. Blue bars, red line, black line as in (E). Right: The ratio of the mean number of common neighbors of connected and unconnected pairs of L5_PCs resulting from the data in the left panel. Blue: data for the two types of L5_TTPCs in the reconstructed connectome, red: (Data from Perin et al., 2011).
Figure 8
Figure 8
Variability and robustness of emergent connectivity. (A) Mean number of synapses per connection for all connection types, against the standard deviation of the mean across N = 7 reconstructions. Blue dots: data, red line: linear fit. Inset: Distribution of the coefficient of variation of the measurements of the mean, i.e., SD divided by mean. Red line: Mean CV. (B) Same, for the mean connection probability of individual connection type. (C) Distributions of the number of synapses in all connections for different neuron densities. Blue: microcircuit containing 31,000 neurons (control case); red: Only 25,000 neurons in the same volume; green: 35,000 neurons in the same volume. Dashed lines with disks indicate the mean. (D) Same for the number of afferent synapses per cell. (E) Box plot of the probabilities that a neuron connects to a randomly picked cell within 100 μm, for different neuron densities. Red lines indicate the median of the probabilities for all cells, blue boxes the 25 and 75 percentiles and black whiskers the full data spread. (F) Means of the connection probabilities for all m-types, normalized to the value of the control case (gray lines). The red line indicates the values expected if the changes in cell density were compensated exclusively by changes in connection probabilities as outlined in Equation (I) and Figure 1, i.e., 31,000/25,000, 1 and 31,000/35,000.

Similar articles

Cited by

References

    1. Anderson J. C., Binzegger T., Douglas R. J., Martin K. A. C. (2002). Chance or design? Some specific considerations concerning synaptic boutons in cat visual cortex. J. Neurocytol. 31, 211–229. 10.1023/A:1024113707630 - DOI - PubMed
    1. Arellano J. I., Benavides-Piccione R., DeFelipe J., Yuste R. (2007). Ultrastructure of dendritic spines: correlation between synaptic and spine morphologies. Front. Neurosci. 1, 131–143. 10.3389/neuro.01.1.1.010.2007 - DOI - PMC - PubMed
    1. Bienenstock E. L., Cooper L. N., Munro P. W. (1982). Theory for the development of neuron selectivity: orientation specificity and binocular interaction in visual cortex. J. Neurosci. 2, 32–48. - PMC - PubMed
    1. Beierlein M., Connors B. W. (2002). Short-term dynamics of thalamocortical and intracortical synapses onto layer 6 neurons in neocortex. J. Neurophysiol. 88, 1924–1932. - PubMed
    1. Bonhoeffer T., Staiger V., Aertsen A. (1989). Synaptic plasticity in rat hippocampal slice cultures: local “Hebbian” conjunction of pre- and postsynaptic stimulation leads to distributed synaptic enhancement. Proc. Natl. Acad. Sci. U.S.A. 86, 8113–8117. 10.1073/pnas.86.20.8113 - DOI - PMC - PubMed

LinkOut - more resources