Refrigerated fruit storage monitoring combining two different wireless sensing technologies: RFID and WSN
- PMID: 25730482
- PMCID: PMC4435195
- DOI: 10.3390/s150304781
Refrigerated fruit storage monitoring combining two different wireless sensing technologies: RFID and WSN
Abstract
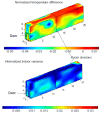
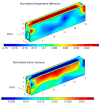
Every day, millions of tons of temperature-sensitive goods are produced, transported, stored or distributed worldwide, thus making their temperature and humidity control essential. Quality control and monitoring of goods during the cold chain is an increasing concern for producers, suppliers, logistic decision makers and consumers. In this paper we present the results of a combination of RFID and WSN devices in a set of studies performed in three commercial wholesale chambers of 1848 m3 with different set points and products. Up to 90 semi-passive RFID temperature loggers were installed simultaneously together with seven motes, during one week in each chamber. 3D temperature mapping charts were obtained and also the psychrometric data model from ASABE was implemented for the calculation of enthalpy changes and the absolute water content of air. Thus thank to the feedback of data, between RFID and WSN it is possible to estimate energy consumption in the cold room, water loss from the products and detect any condensation over the stored commodities.
Figures


Similar articles
-
Testing ZigBee motes for monitoring refrigerated vegetable transportation under real conditions.Sensors (Basel). 2010;10(5):4968-82. doi: 10.3390/s100504968. Epub 2010 May 18. Sensors (Basel). 2010. PMID: 22399917 Free PMC article.
-
A review of wireless sensor technologies and applications in agriculture and food industry: state of the art and current trends.Sensors (Basel). 2009;9(6):4728-50. doi: 10.3390/s90604728. Epub 2009 Jun 16. Sensors (Basel). 2009. PMID: 22408551 Free PMC article.
-
Spatio-Temporal Optimization of Perishable Goods' Shelf Life by a Pro-Active WSN-Based Architecture.Sensors (Basel). 2018 Jul 2;18(7):2126. doi: 10.3390/s18072126. Sensors (Basel). 2018. PMID: 30004468 Free PMC article.
-
A Review of IoT Sensing Applications and Challenges Using RFID and Wireless Sensor Networks.Sensors (Basel). 2020 Apr 28;20(9):2495. doi: 10.3390/s20092495. Sensors (Basel). 2020. PMID: 32354063 Free PMC article. Review.
-
Leveraging LoRaWAN Technology for Precision Agriculture in Greenhouses.Sensors (Basel). 2020 Mar 25;20(7):1827. doi: 10.3390/s20071827. Sensors (Basel). 2020. PMID: 32218353 Free PMC article. Review.
Cited by
-
A 0.0014 mm2 150 nW CMOS Temperature Sensor with Nonlinearity Characterization and Calibration for the -60 to +40 °C Measurement Range.Sensors (Basel). 2019 Apr 13;19(8):1777. doi: 10.3390/s19081777. Sensors (Basel). 2019. PMID: 31013907 Free PMC article.
-
Evaluation of IoT-Enabled Monitoring and Electronic Nose Spoilage Detection for Salmon Freshness During Cold Storage.Foods. 2020 Oct 30;9(11):1579. doi: 10.3390/foods9111579. Foods. 2020. PMID: 33143312 Free PMC article.
-
The Effect of Traceability System and Managerial Initiative on Indonesian Food Cold Chain Performance: A Covid-19 Pandemic Perspective.Glob J Flex Syst Manag. 2021;22(4):331-356. doi: 10.1007/s40171-021-00281-x. Epub 2021 Aug 3. Glob J Flex Syst Manag. 2021. PMID: 36748031 Free PMC article.
-
Fruit Quality Monitoring with Smart Packaging.Sensors (Basel). 2021 Feb 22;21(4):1509. doi: 10.3390/s21041509. Sensors (Basel). 2021. PMID: 33671571 Free PMC article. Review.
-
Abnormal Condition Monitoring of Workpieces Based on RFID for Wisdom Manufacturing Workshops.Sensors (Basel). 2015 Dec 3;15(12):30165-86. doi: 10.3390/s151229789. Sensors (Basel). 2015. PMID: 26633418 Free PMC article.
References
-
- Ruiz-Garcia L., Lunadei L. The role of RFID in agriculture: Applications, limitations and challenges. Comput. Electron. Agric. 2011;79:42–50. doi: 10.1016/j.compag.2011.08.010. - DOI
-
- Gwanpuaa S.G., Verbovena P., Leducqb D., Brownc T., Verlindend B.E., Bekelea E., Aregawia W., Evansc J., Fosterc A., Duretb S., et al. The FRISBEE tool, a software for optimising the trade-off between food quality, energy use, and global warming impact of cold chains. J. Food Eng. 2015;148:2–12. doi: 10.1016/j.jfoodeng.2014.06.021. - DOI
-
- Gustavsson J., Cederberg C., Sonesson U., Otterdijk R., Meybeck A. Interpack 2011. Food and Agriculture Organization of the United Nations; Rome, Italy: 2011. Global food losses and food waste: Extent, causes and prevention.
-
- Kim W.R., Aung M.M., Chang Y.S., Makatsoris C. Freshness Gauge based cold storage management: A method for adjusting temperature and humidity levels for food quality. Food Control. 2015;47:510–519. doi: 10.1016/j.foodcont.2014.07.051. - DOI
-
- Jedermann R., Nicometo M., Uysal I., Opara L., Janssen S., Lang W. Intelligent food logistics. The Royal Society; London, UK: 2015.
LinkOut - more resources
Full Text Sources
Other Literature Sources

