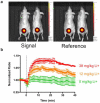
Optical drug monitoring: photoacoustic imaging of nanosensors to monitor therapeutic lithium in vivo
- PMID: 25588028
- PMCID: PMC4364417
- DOI: 10.1021/nn5064858
Optical drug monitoring: photoacoustic imaging of nanosensors to monitor therapeutic lithium in vivo
Abstract
Personalized medicine could revolutionize how primary care physicians treat chronic disease and how researchers study fundamental biological questions. To realize this goal, we need to develop more robust, modular tools and imaging approaches for in vivo monitoring of analytes. In this report, we demonstrate that synthetic nanosensors can measure physiologic parameters with photoacoustic contrast, and we apply that platform to continuously track lithium levels in vivo. Photoacoustic imaging achieves imaging depths that are unattainable with fluorescence or multiphoton microscopy. We validated the photoacoustic results that illustrate the superior imaging depth and quality of photoacoustic imaging with optical measurements. This powerful combination of techniques will unlock the ability to measure analyte changes in deep tissue and will open up photoacoustic imaging as a diagnostic tool for continuous physiological tracking of a wide range of analytes.
Keywords: bipolar; continuous monitoring; diagnostic; nanomedicine; nanoparticle.
Figures


Similar articles
-
Optical clearing agents improve photoacoustic imaging in the optical diffusive regime.Opt Lett. 2013 Oct 15;38(20):4236-9. doi: 10.1364/OL.38.004236. Opt Lett. 2013. PMID: 24321968
-
Stimuli-responsive photoacoustic nanoswitch for in vivo sensing applications.ACS Nano. 2014 Aug 26;8(8):8363-73. doi: 10.1021/nn502858b. ACS Nano. 2014. PMID: 25046406
-
Photoacoustic Imaging in Tissue Engineering and Regenerative Medicine.Tissue Eng Part B Rev. 2020 Feb;26(1):79-102. doi: 10.1089/ten.TEB.2019.0296. Epub 2020 Jan 14. Tissue Eng Part B Rev. 2020. PMID: 31854242 Free PMC article. Review.
-
Phosphorescent nanosensors for in vivo tracking of histamine levels.Anal Chem. 2013 Jul 2;85(13):6312-8. doi: 10.1021/ac400575u. Epub 2013 Jun 14. Anal Chem. 2013. PMID: 23767828 Free PMC article.
-
Recent Developments in Nanosensors for Imaging Applications in Biological Systems.Annu Rev Anal Chem (Palo Alto Calif). 2019 Jun 12;12(1):109-128. doi: 10.1146/annurev-anchem-061417-125747. Epub 2019 Mar 11. Annu Rev Anal Chem (Palo Alto Calif). 2019. PMID: 30857408 Free PMC article. Review.
Cited by
-
Mass transfer in heterogeneous biofilms: Key issues in biofilm reactors and AI-driven performance prediction.Environ Sci Ecotechnol. 2024 Aug 29;22:100480. doi: 10.1016/j.ese.2024.100480. eCollection 2024 Nov. Environ Sci Ecotechnol. 2024. PMID: 39309319 Free PMC article. Review.
-
Using imaging modalities to predict nanoparticle distribution and treatment efficacy in solid tumors: The growing role of ultrasound.Wiley Interdiscip Rev Nanomed Nanobiotechnol. 2024 Mar-Apr;16(2):e1957. doi: 10.1002/wnan.1957. Wiley Interdiscip Rev Nanomed Nanobiotechnol. 2024. PMID: 38558290 Review.
-
Multifunction fluorescence open source in vivo/in vitro imaging system (openIVIS).PLoS One. 2024 Mar 18;19(3):e0299875. doi: 10.1371/journal.pone.0299875. eCollection 2024. PLoS One. 2024. PMID: 38498588 Free PMC article.
-
Shedding light on ultrasound in action: Optical and optoacoustic monitoring of ultrasound brain interventions.Adv Drug Deliv Rev. 2024 Feb;205:115177. doi: 10.1016/j.addr.2023.115177. Epub 2024 Jan 5. Adv Drug Deliv Rev. 2024. PMID: 38184194 Free PMC article. Review.
-
Photoacoustic Chemical Imaging Sodium Nano-Sensor Utilizing a Solvatochromic Dye Transducer for In Vivo Application.Biosensors (Basel). 2023 Oct 11;13(10):923. doi: 10.3390/bios13100923. Biosensors (Basel). 2023. PMID: 37887116 Free PMC article.
References
Publication types
MeSH terms
Substances
Grants and funding
LinkOut - more resources
Full Text Sources
Other Literature Sources

