Mutual information between discrete and continuous data sets
- PMID: 24586270
- PMCID: PMC3929353
- DOI: 10.1371/journal.pone.0087357
Mutual information between discrete and continuous data sets
Abstract
Mutual information (MI) is a powerful method for detecting relationships between data sets. There are accurate methods for estimating MI that avoid problems with "binning" when both data sets are discrete or when both data sets are continuous. We present an accurate, non-binning MI estimator for the case of one discrete data set and one continuous data set. This case applies when measuring, for example, the relationship between base sequence and gene expression level, or the effect of a cancer drug on patient survival time. We also show how our method can be adapted to calculate the Jensen-Shannon divergence of two or more data sets.
Conflict of interest statement
Figures

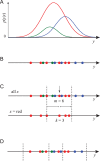
 where
where  is a real-valued scalar and
  can take one of three values, indicated red, blue and green. For each value of
  the probability density in
  is shown as plot of that color, whose area is proportional to
  . (B) A set of
  data pairs sampled from this distribution, where
  is represented by the color of each point and
  by its position on the
  -axis. (C) The computation of
  in our nearest-neighbor method. Data point
  is the red dot indicated by a vertical arrow. The full data set is on the upper line, and the subset of all red data points is on the lower line. We find that the data point which is the 3rd-closest neighbor to
  on the bottom line is the 6th-closest neighbor on the top line. Dashed lines show the distance
  from point
  out to the 3rd neighbor.
  ,
,  , and for this point
  and
and  . (D) A binning of the data into equal bins containing
  data points. MI can be estimated from the numbers of points of each color in each bin.
 (thick lines) represented by a differently-colored graph in
  for each of three possible values of the discrete variable
  (red, blue and green). A histogram of a representative data set for each distribution is overlaid using a thinner line. (B) MI estimates as a function of
  using the nearest-neighbor estimator. 100 data sets were constructed for each distribution, and the MI of each data set was estimated separately for different values of
  . The median MI estimate of the 100 data sets for each
  -value is shown with a black line; the shaded region indicates the range (lowest 10% to highest 10%) of MI estimates. (C) MI estimates plotted as a function of bin size
  using the binning method (right panel), using the same 100 data sets for each distribution. The black line shows the median MI estimate of the 100 data sets for each
  -value; the shaded region indicates the 10%–90% range
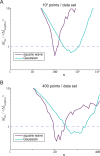
 estimated using binning, as a function of n, to the median (over all data sets and all values of
  ) of all MI estimates using nearest neighbors. The binning method gives superior results for values of
  for which this ratio is less than one. Evidently, there is no optimal value of
  that works for all distributions:
  works well for the square wave distribution but
  is better for a Gaussian distribution. (B) MI error using nearest-neigbor method versus binning method for the 400-data point sets.
Similar articles
-
MIA: Mutual Information Analyzer, a graphic user interface program that calculates entropy, vertical and horizontal mutual information of molecular sequence sets.BMC Bioinformatics. 2015 Dec 10;16:409. doi: 10.1186/s12859-015-0837-0. BMC Bioinformatics. 2015. PMID: 26652707 Free PMC article.
-
[Comparison study on the methods for finding borders between coding and non-coding DNA regions in rice].Yi Chuan. 2005 Jul;27(4):629-35. Yi Chuan. 2005. PMID: 16120591 Chinese.
-
Approximations of Shannon Mutual Information for Discrete Variables with Applications to Neural Population Coding.Entropy (Basel). 2019 Mar 4;21(3):243. doi: 10.3390/e21030243. Entropy (Basel). 2019. PMID: 33266958 Free PMC article.
-
Discrete dynamic modeling with asynchronous update, or how to model complex systems in the absence of quantitative information.Methods Mol Biol. 2009;553:207-25. doi: 10.1007/978-1-60327-563-7_10. Methods Mol Biol. 2009. PMID: 19588107 Review.
-
Genes, information and sense: complexity and knowledge retrieval.Theory Biosci. 2008 Jun;127(2):69-78. doi: 10.1007/s12064-008-0032-1. Epub 2008 Apr 29. Theory Biosci. 2008. PMID: 18443840 Review.
Cited by
-
Automated CT Lung Density Analysis of Viral Pneumonia and Healthy Lungs Using Deep Learning-Based Segmentation, Histograms and HU Thresholds.Diagnostics (Basel). 2021 Apr 21;11(5):738. doi: 10.3390/diagnostics11050738. Diagnostics (Basel). 2021. PMID: 33919094 Free PMC article.
-
Cell type-specific genome scans of DNA methylation divergence indicate an important role for transposable elements.Genome Biol. 2020 Jul 13;21(1):172. doi: 10.1186/s13059-020-02068-2. Genome Biol. 2020. PMID: 32660534 Free PMC article.
-
Perceived Realism of High-Resolution Generative Adversarial Network-derived Synthetic Mammograms.Radiol Artif Intell. 2020 Dec 23;3(2):e190181. doi: 10.1148/ryai.2020190181. eCollection 2021 Mar. Radiol Artif Intell. 2020. PMID: 33937856 Free PMC article.
-
Estimating Prevalence and Characteristics of Statin Intolerance among High and Very High Cardiovascular Risk Patients in Germany (2017 to 2020).J Clin Med. 2023 Jan 16;12(2):705. doi: 10.3390/jcm12020705. J Clin Med. 2023. PMID: 36675634 Free PMC article.
-
Epidemiology of rabies immune globulin use in paediatric and adult patients in the USA: a cross-sectional prevalence study.BMJ Open. 2022 Apr 26;12(4):e055411. doi: 10.1136/bmjopen-2021-055411. BMJ Open. 2022. PMID: 35473745 Free PMC article.
References
-
- Cover T, Thomas J (1991) Elements of information theory. New York: John Wiley & Sons.
-
- Kraskov A, Stögbauer H, Grassberger P (2004) Estimating mutual information. Physical Review E 69: 066138. - PubMed
-
- Grosse I, Bernaola-Galván P, Carpena P, Román-Roldán R, Oliver J, et al. (2002) Analysis of symbolic sequences using the jensen-shannon divergence. Physical Review E 65: 041905. - PubMed
-
- Abramowitz M, Stegun I (1970) Handbook of mathematical functions. New York: Dover Publishing Inc.
-
- Kozachenko L, Leonenko NN (1987) Sample estimate of the entropy of a random vector. Problemy Peredachi Informatsii 23: 9–16.
MeSH terms
Substances
Grants and funding
LinkOut - more resources
Full Text Sources
Other Literature Sources

