Translational biomarker discovery in clinical metabolomics: an introductory tutorial
- PMID: 23543913
- PMCID: PMC3608878
- DOI: 10.1007/s11306-012-0482-9
Translational biomarker discovery in clinical metabolomics: an introductory tutorial
Abstract
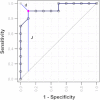
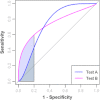
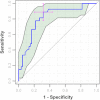
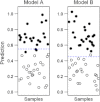
Metabolomics is increasingly being applied towards the identification of biomarkers for disease diagnosis, prognosis and risk prediction. Unfortunately among the many published metabolomic studies focusing on biomarker discovery, there is very little consistency and relatively little rigor in how researchers select, assess or report their candidate biomarkers. In particular, few studies report any measure of sensitivity, specificity, or provide receiver operator characteristic (ROC) curves with associated confidence intervals. Even fewer studies explicitly describe or release the biomarker model used to generate their ROC curves. This is surprising given that for biomarker studies in most other biomedical fields, ROC curve analysis is generally considered the standard method for performance assessment. Because the ultimate goal of biomarker discovery is the translation of those biomarkers to clinical practice, it is clear that the metabolomics community needs to start "speaking the same language" in terms of biomarker analysis and reporting-especially if it wants to see metabolite markers being routinely used in the clinic. In this tutorial, we will first introduce the concept of ROC curves and describe their use in single biomarker analysis for clinical chemistry. This includes the construction of ROC curves, understanding the meaning of area under ROC curves (AUC) and partial AUC, as well as the calculation of confidence intervals. The second part of the tutorial focuses on biomarker analyses within the context of metabolomics. This section describes different statistical and machine learning strategies that can be used to create multi-metabolite biomarker models and explains how these models can be assessed using ROC curves. In the third part of the tutorial we discuss common issues and potential pitfalls associated with different analysis methods and provide readers with a list of nine recommendations for biomarker analysis and reporting. To help readers test, visualize and explore the concepts presented in this tutorial, we also introduce a web-based tool called ROCCET (ROC Curve Explorer & Tester, http://www.roccet.ca). ROCCET was originally developed as a teaching aid but it can also serve as a training and testing resource to assist metabolomics researchers build biomarker models and conduct a range of common ROC curve analyses for biomarker studies.
Keywords: AUC; Biomarker analysis; Biomarker validation and reporting; Bootstrapping; Confidence intervals; Cross validation; Optimal threshold; ROC curve; Sample size.
Figures


Similar articles
-
Folic acid supplementation and malaria susceptibility and severity among people taking antifolate antimalarial drugs in endemic areas.Cochrane Database Syst Rev. 2022 Feb 1;2(2022):CD014217. doi: 10.1002/14651858.CD014217. Cochrane Database Syst Rev. 2022. PMID: 36321557 Free PMC article.
-
Translational Metabolomics of Head Injury: Exploring Dysfunctional Cerebral Metabolism with Ex Vivo NMR Spectroscopy-Based Metabolite Quantification.In: Kobeissy FH, editor. Brain Neurotrauma: Molecular, Neuropsychological, and Rehabilitation Aspects. Boca Raton (FL): CRC Press/Taylor & Francis; 2015. Chapter 25. In: Kobeissy FH, editor. Brain Neurotrauma: Molecular, Neuropsychological, and Rehabilitation Aspects. Boca Raton (FL): CRC Press/Taylor & Francis; 2015. Chapter 25. PMID: 26269925 Free Books & Documents. Review.
-
The future of Cochrane Neonatal.Early Hum Dev. 2020 Nov;150:105191. doi: 10.1016/j.earlhumdev.2020.105191. Epub 2020 Sep 12. Early Hum Dev. 2020. PMID: 33036834
-
Exploring medical diagnostic performance using interactive, multi-parameter sourced receiver operating characteristic scatter plots.Comput Biol Med. 2014 Apr;47:120-9. doi: 10.1016/j.compbiomed.2014.01.012. Epub 2014 Feb 3. Comput Biol Med. 2014. PMID: 24561350
-
Statistics in diagnostic medicine.Clin Chem Lab Med. 2022 Mar 31;60(6):801-807. doi: 10.1515/cclm-2022-0225. Print 2022 May 25. Clin Chem Lab Med. 2022. PMID: 35357790 Review.
Cited by
-
Serum levels of lipid metabolites in age-related macular degeneration.FASEB J. 2015 Nov;29(11):4579-88. doi: 10.1096/fj.15-275289. Epub 2015 Jul 17. FASEB J. 2015. PMID: 26187344 Free PMC article.
-
Validation of plasma protein glycation and oxidation biomarkers for the diagnosis of autism.Mol Psychiatry. 2024 Mar;29(3):653-659. doi: 10.1038/s41380-023-02357-9. Epub 2023 Dec 22. Mol Psychiatry. 2024. PMID: 38135754 Free PMC article.
-
Disturbances in Muscle Energy Metabolism in Patients with Amyotrophic Lateral Sclerosis.Metabolites. 2024 Jun 23;14(7):356. doi: 10.3390/metabo14070356. Metabolites. 2024. PMID: 39057679 Free PMC article.
-
Comparative metabolite profiling of a metastatic and primary melanoma cell line using untargeted metabolomics: A case study.Clin Mass Spectrom. 2018 Aug 3;10:16-24. doi: 10.1016/j.clinms.2018.08.001. eCollection 2018 Dec. Clin Mass Spectrom. 2018. PMID: 39193356 Free PMC article.
-
Mass spectrometry-based proteomics analysis of human globus pallidus from progressive supranuclear palsy patients discovers multiple disease pathways.Clin Transl Med. 2022 Nov;12(11):e1076. doi: 10.1002/ctm2.1076. Clin Transl Med. 2022. PMID: 36354133 Free PMC article.
References
-
- Bamber D. The area above the ordinal dominance graph and the area below the receiver operating characteristic graph. Journal of Mathematical Psychology. 1975;12(4):387–415. doi: 10.1016/0022-2496(75)90001-2. - DOI
LinkOut - more resources
Full Text Sources
Other Literature Sources
