A microRNA-30e/mitochondrial uncoupling protein 2 axis mediates TGF-β1-induced tubular epithelial cell extracellular matrix production and kidney fibrosis - PubMed Skip to main page content
U.S. flag

An official website of the United States government

Dot gov

The .gov means it’s official.
Federal government websites often end in .gov or .mil. Before sharing sensitive information, make sure you’re on a federal government site.

Https

The site is secure.
The https:// ensures that you are connecting to the official website and that any information you provide is encrypted and transmitted securely.

Access keys NCBI Homepage MyNCBI Homepage Main Content Main Navigation
. 2013 Aug;84(2):285-96.
doi: 10.1038/ki.2013.80. Epub 2013 Mar 20.

A microRNA-30e/mitochondrial uncoupling protein 2 axis mediates TGF-β1-induced tubular epithelial cell extracellular matrix production and kidney fibrosis

Affiliations
Free PMC article

A microRNA-30e/mitochondrial uncoupling protein 2 axis mediates TGF-β1-induced tubular epithelial cell extracellular matrix production and kidney fibrosis

Lei Jiang et al. Kidney Int. 2013 Aug.
Free PMC article

Abstract

Mitochondria dysfunction has been reported in various kidney diseases but how it leads to kidney fibrosis and how this is regulated is unknown. Here we found that mitochondrial uncoupling protein 2 (UCP2) was induced in kidney tubular epithelial cells after unilateral ureteral obstruction in mice and that mice with ablated UCP2 resisted obstruction-induced kidney fibrosis. We tested this association further in cultured NRK-52E cells and found that TGF-β1 remarkably induced UCP2 expression. Knockdown of UCP2 largely abolished the effect of TGF-β1, whereas overexpression of UCP2 promoted tubular cell phenotype changes. Analysis using a UCP2 mRNA-3'-untranslated region luciferase construct showed that UCP2 mRNA is a direct target of miR-30e. MiR-30e was downregulated in tubular cells from fibrotic kidneys and TGF-β1-treated NRK-52E cells. A miR-30e mimic significantly inhibited TGF-β1-induced tubular-cell epithelial-mesenchymal transition, whereas a miR-30e inhibitor imitated TGF-β1 effects. Finally, genipin, an aglycone UCP2 inhibitor, significantly ameliorated kidney fibrosis in mice. Thus, the miR-30e/UCP2 axis has an important role in mediating TGF-β1-induced epithelial-mesenchymal transition and kidney fibrosis. Targeting this pathway may shed new light for the future of fibrotic kidney disease therapy.


Figures

Figure 1
Figure 1
Uncoupling protein 2 (UCP2) is induced in tubular cells from kidneys with obstructive nephropathy. (a) Reverse transcriptase PCR analysis of UCP2 mRNA expression in whole-tissue lysate of the sham and obstructed kidneys. (b) Quantitative real-time PCR analysis reveals that UCP2 mRNA is upregulated after unilateral ureteral occlusion (UUO). Glyceraldehyde 3-phosphate dehydrogenase (GAPDH) was detected as normalization (*P<0.05 compared with control; n=5; mean±s.e.m. as shown). (c) Western blot shows UCP2 protein expression in the obstructive kidneys at day 3 and 7 after UUO. β-Actin was probed to confirm equal loading. (d) Graphic presentation of the relative abundance of UCP2 protein in kidneys (*P<0.05 compared with sham; n=3; mean±s.e.m. as shown). (e) Representative immunohistochemical staining images for UCP2 protein in normal and the obstructed kidneys at day 3 and 7 after UUO.
Figure 2
Figure 2
Uncoupling protein 2 (UCP2) deletion protects against obstructive nephropathy in mice. (ad) Representative hematoxylin and eosin staining micrographs show kidney morphology in sham control (a, c) and fibrotic kidneys (b, d) at day 7 in UCP2−/− (c, d) and wild-type (a, b) mice. (eh) Representative Masson–Trichrome staining images for kidneys at day 7 after unilateral ureteral occlusion (UUO) in UCP2−/− (h) and wild-type (f) mice. (i) Semiquantitative analysis of matrix deposition in each group (*P<0.05 compared with sham; n=5; #P<0.05 vs UUO in UCP2+/+ mice; n=5; mean±s.e.m. as shown). (j) Western blot shows fibronectin (FN), E-cadherin, and α-smooth muscle actin (α-SMA) expression in the whole kidneys after UUO in UCP2−/− and UCP2+/+ mice. The samples were reprobed with anti-β-actin to confirm equal loading. (k) Transforming growth factor-β1 (TGF-β1) protein level in the obstructed kidneys from UCP2+/+ and UCP2−/− mice was determined by enzyme-linked immunosorbent assay (*P<0.05 compared with sham; n=5; mean±s.e.m. as shown). (l) Western blot shows TGF-β1 type I receptor and phosphorylated Smad3 abundance in the whole kidneys.
Figure 3
Figure 3
Uncoupling protein 2 (UCP2) is induced by transforming growth factor-β1 (TGF-β1) treatment in NRK-52E cells. NRK-52E cells were treated with 5 ng/ml of TGF-β1 for various periods of time as indicated. (a) Reverse transcriptase PCR analysis for UCP2 mRNA expression. (b) Quantitative real-time PCR analysis shows UCP2 mRNA expression in NRK-52E cells. Glyceraldehyde 3-phosphate dehydrogenase (GAPDH) was detected as normalization (*P<0.05 compared with control; n=3; mean±s.e.m. as shown).(c) Western blot shows UCP2 expression in NRK-52E cells. The samples were reprobed with anti-β-actin to confirm equal loading. (d) Graphic presentation of relative abundance of UCP2 protein (*P<0.05 compared with control; n=3; mean±s.e.m. as shown).
Figure 4
Figure 4
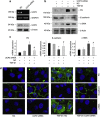
Knockdown of uncoupling protein 2 (UCP2) inhibits transforming growth factor-β1 (TGF-β1)-induced extracellular matrix production in NRK-52E cells. Reverse transcriptase PCR and western blot analysis show UCP2 mRNA (a) and protein (d) abundance after UCP2 small interfering RNA (siRNA) transfection. (c) Quantitative PCR analysis shows the mRNA expression for fibronectin (FN), α-smooth muscle actin (α-SMA), and E-cadherin in NRK-52E cells stimulated by TGF-β1 for 48 h along with UCP2 or scramble siRNA transfection. Glyceraldehyde 3-phosphate dehydrogenase (GAPDH) was detected as normalization (*P<0.05 compared with control; n=3; #P<0.05 vs cells treated with TGF-β1 plus scramble siRNA transfection; n=3; mean±s.e.m. as shown). (d) Representative immunofluorescent staining images for FN, α-SMA, and E-cadherin in NRK-52E cells.
Figure 5
Figure 5
Ectopic expression of uncoupling protein 2 (UCP2) induces NRK-52E-cell extracellular matrix production. (a) Quantitative real-time PCR reveals UCP2, fibronectin (FN), and α-smooth muscle actin (α-SMA) mRNA upregulation, and E-cadherin mRNA downregulation, in NRK-52E cells after UCP2 plasmid transfection. Glyceraldehyde 3-phosphate dehydrogenase is detected as normalization (*P<0.05 compared with pcDNA3; n=3; mean±s.e.m. as shown). (b) Quantitative real-time PCR shows UCP2, FN, α-SMA, and E-cadherin mRNA abundance in NRK-52E cells (*P<0.05 compared with pcDNA3; #P<0.05 vs transforming growth factor-β1 (TGF-β1) treatment; n=3; mean±s.e.m. as shown). (c) Western blot analysis shows that UCP2 plasmid transfection induced NRK-52E-cell extracellular matrix production. (d) Western blot analysis shows that pre-transfection of UCP2 plasmid amplified the effects of TGF-β1 on NRK-52E cells.
Figure 6
Figure 6
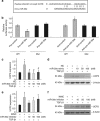
Uncoupling protein 2 (UCP2) is a direct target of miR-30e. (a) Predicted consequential pairing of UCP2 and miR-30e. (b) Firefly luciferase reporters containing either wild-type (WT) or mutant (Mut) UCP2 3′-untranslated region (UTR) were cotransfected into NRK-52E cells with pre-miR-30e, pre-control, pre-anti-miR-30e, and pre-anti-control. Luciferase activity was determined at 24 h after transfection. Real-time PCR analysis (c) and western blot analysis (d) for UCP2 expression in NRK-52E cells (*P<0.05 compared with control; n=3; #P<0.05 vs cells treated with TGF-β1 plus negative control; n=3; mean±s.e.m. as shown). Real-time PCR analysis (e) and western blot analysis (f) detected UCP2 expression after miR-30e-inhibitor treatment in NRK-52E cells (*P<0.05 compared with inhibitor negative control (INNC); n=3; mean±s.e.m. as shown).
Figure 7
Figure 7
MiR-30e is downregulated in tubular cells from fibrotic kidneys with obstructive nephropathy. (a) The profile of microRNAs (miRNAs) expression in the obstructive kidneys at day 3 and 7 after unilateral ureteral occlusion (UUO). (b) Real-time PCR analysis for miR-30e expression; U6 snRNA was detected as normalization (*P<0.05 compared with sham control; n=5; mean±s.e.m. as shown). (cf) In situ hybridization results show that miR-30e was detected in kidney tubular cells from sham control (c) and was almost gone in tubular cells at day 7 after UUO (d). (e) Sham, scramble. (f) UUO, scramble.
Figure 8
Figure 8
MiR-30e regulates NRK-52E-cell extracellular matrix production. (a) Real-time PCR analysis for miR-30e expression after transforming growth factor-β1 (TGF-β1) (5 ng/ml) treatment in NRK-52E cells; U6 snRNA was detected as normalization (*P<0.05 compared with control; n=3; mean±s.e.m. as shown). (b) Real-time PCR analysis for miR-30e expression after TGF-β1 treatment in NRK-52E cells transfected with or without Smad7 expressed plasmid for 12 h (*P<0.05 compared with pcDNA3 transfection; n=3; #P<0.05 vs TGF-β1 treatment in pcDNA3 transfected cells; n=3; mean±s.e.m. as shown). (c) Real-time PCR analysis for miR-30e expression after miR-30e-mimic treatment; U6 snRNA was detected as normalization (*P<0.05 compared with negative control; n=3; mean±s.e.m. as shown). (d) Real-time PCR analysis for miR-30e expression after miR-30e-inhibitor treatment; U6 snRNA was detected as normalization (*P<0.05 compared with negative control; n=3; mean±s.e.m. as shown). (e) Western blot analysis shows fibronectin (FN), α-smooth muscle actin (α-SMA), and E-cadherin expression after miR-30e-mimic transfection along with TGF-β1 treatment. (f) Western blot analysis shows miR-30e-inhibitor transfection reduced E-cadherin and increased FN and α-SMA expression.
Figure 9
Figure 9
miR-30e regulates tubular cell phenotype changes via targeting uncoupling protein 2 (UCP2). (a) Western blot analysis for fibronectin (FN), α-smooth muscle actin (α-SMA), and E-cadherin expression in NRK-52E cells. (b) Graphic presentation of the relative abundance of FN, E-cadherin, and α-SMA protein expression (*P<0.05 compared with negative control (NC) transfection, n=3; #P<0.05 vs miR-30e-inhibitor transfection; n=3; mean±s.e.m. as shown). (c) Western blot detects FN, α-SMA, and E-cadherin expression in NRK-52E cells. (d) Graphic presentation of the relative abundance of FN, E-cadherin, and α-SMA protein expression (*P<0.05 compared with NC transfection; n=3; #P<0.05 vs transforming growth factor-β1 (TGF-β1) with NC transfection; n=3; φP<0.05 vs TGF-β1 with miR-30e-mimic transfection; n=3; mean±s.e.m. as shown).
Figure 10
Figure 10
Blocking of uncoupling protein 2 (UCP2) with genipin attenuates obstructive nephropathy in mice. (ah) Representative hematoxylin and eosin staining (a d) or Masson–Trichrome staining (eh) micrographs show kidney histology in sham control treated with vehicle (a. e) or genipin (b, f), and unilateral ureteral occlusion (UUO) mice treated with vehicle (c, g) or genipin (d, h). (i): Morphometric analysis of kidney fibrosis in the UUO model (*P<0.05 compared with sham control; n=5; #P<0.05 vs UUO mice treated with vehicle; mean±s.e.m. as shown). (j) Western blot results show FN and α-SMA abundance in kidney from mice administrated with genipin or vehicle. (k) Graphic presentation of the relative abundance of FN and α-SMA protein in kidneys (*P<0.05 compared with sham; n=5; #P<0.05 vs UUO mice; n=5; mean±s.e.m. as shown).

Similar articles

Cited by

References

    1. Schnaper HW, Kopp JB. Renal fibrosis. Front Biosci. 2003;8:e68–e86. - PubMed
    1. Kalluri R, Neilson EG. Epithelial-mesenchymal transition and its implications for fibrosis. J Clin Invest. 2003;112:1776–1784. - PMC - PubMed
    1. Rastaldi MP. Epithelial-mesenchymal transition and its implications for the development of renal tubulointerstitial fibrosis. J Nephrol. 2006;19:407–412. - PubMed
    1. Balaban RS, Mandel LJ. Metabolic substrate utilization by rabbit proximal tubule. An NADH fluorescence study. Am J Physiol. 1988;254:F407–F416. - PubMed
    1. Wirthensohn G, Guder WG. Renal substrate metabolism. Physiol Rev. 1986;66:469–497. - PubMed

Publication types

MeSH terms

LinkOut - more resources