An anatomically comprehensive atlas of the adult human brain transcriptome - PubMed Skip to main page content
U.S. flag

An official website of the United States government

Dot gov

The .gov means it’s official.
Federal government websites often end in .gov or .mil. Before sharing sensitive information, make sure you’re on a federal government site.

Https

The site is secure.
The https:// ensures that you are connecting to the official website and that any information you provide is encrypted and transmitted securely.

Access keys NCBI Homepage MyNCBI Homepage Main Content Main Navigation
. 2012 Sep 20;489(7416):391-399.
doi: 10.1038/nature11405.

An anatomically comprehensive atlas of the adult human brain transcriptome

Michael J Hawrylycz #  1 Ed S Lein #  1 Angela L Guillozet-Bongaarts  1 Elaine H Shen  1 Lydia Ng  1 Jeremy A Miller  1 Louie N van de Lagemaat  2 Kimberly A Smith  1 Amanda Ebbert  1 Zackery L Riley  1 Chris Abajian  1 Christian F Beckmann  3 Amy Bernard  1 Darren Bertagnolli  1 Andrew F Boe  1 Preston M Cartagena  4 M Mallar Chakravarty  5 Mike Chapin  1 Jimmy Chong  1 Rachel A Dalley  1 Barry David Daly  6 Chinh Dang  1 Suvro Datta  1 Nick Dee  1 Tim A Dolbeare  1 Vance Faber  1 David Feng  1 David R Fowler  7 Jeff Goldy  1 Benjamin W Gregor  1 Zeb Haradon  1 David R Haynor  8 John G Hohmann  1 Steve Horvath  9 Robert E Howard  1 Andreas Jeromin  10 Jayson M Jochim  1 Marty Kinnunen  1 Christopher Lau  1 Evan T Lazarz  1 Changkyu Lee  1 Tracy A Lemon  1 Ling Li  11 Yang Li  1 John A Morris  1 Caroline C Overly  1 Patrick D Parker  1 Sheana E Parry  1 Melissa Reding  1 Joshua J Royall  1 Jay Schulkin  12 Pedro Adolfo Sequeira  13 Clifford R Slaughterbeck  1 Simon C Smith  14 Andy J Sodt  1 Susan M Sunkin  1 Beryl E Swanson  1 Marquis P Vawter  13 Derric Williams  1 Paul Wohnoutka  1 H Ronald Zielke  15 Daniel H Geschwind  16 Patrick R Hof  17 Stephen M Smith  18 Christof Koch  19 Seth G N Grant  2 Allan R Jones  1
Affiliations

An anatomically comprehensive atlas of the adult human brain transcriptome

Michael J Hawrylycz et al. Nature. .

Abstract

Neuroanatomically precise, genome-wide maps of transcript distributions are critical resources to complement genomic sequence data and to correlate functional and genetic brain architecture. Here we describe the generation and analysis of a transcriptional atlas of the adult human brain, comprising extensive histological analysis and comprehensive microarray profiling of ∼900 neuroanatomically precise subdivisions in two individuals. Transcriptional regulation varies enormously by anatomical location, with different regions and their constituent cell types displaying robust molecular signatures that are highly conserved between individuals. Analysis of differential gene expression and gene co-expression relationships demonstrates that brain-wide variation strongly reflects the distributions of major cell classes such as neurons, oligodendrocytes, astrocytes and microglia. Local neighbourhood relationships between fine anatomical subdivisions are associated with discrete neuronal subtypes and genes involved with synaptic transmission. The neocortex displays a relatively homogeneous transcriptional pattern, but with distinct features associated selectively with primary sensorimotor cortices and with enriched frontal lobe expression. Notably, the spatial topography of the neocortex is strongly reflected in its molecular topography-the closer two cortical regions, the more similar their transcriptomes. This freely accessible online data resource forms a high-resolution transcriptional baseline for neurogenetic studies of normal and abnormal human brain function.


Figures

Figure 1
Figure 1. Data generation and analysis pipeline
a, Experimental strategy to subdivide intact brains and isolate precise anatomical samples. b, Anatomical reference data are collected at each stage, including whole-brain MRI, large-format slab face and histology, medium (2 × 3-inch slide) format Nissl histology and ISH, and images of dissections. In Brain 2, labelling was performed for additional markers as shown. Histology data are used to identify structures, which are assembled into a database using a formal neuroanatomical ontology (d), and to guide laser microdissection of samples (a, lower panel). Isolated RNA is used for microarray profiling of ~900 samples per brain (b, lower panel). c, Microarray data are normalized and sample coordinates mapped to native 3D MRI coordinates. e, Data visualization and mining tools underlie the online public data resource. Numbers in a and b denote the order of sample processing steps leading to microarray data generation.
Figure 2
Figure 2. Topography of transcript distributions for dopamine-signalling- and postsynaptic-density-associated genes
a, Gene expression profiles of genes associated with dopamine signalling plotted across 170 brain structures in two brains. Expression profiles for each probe plotted as raw microarray data normalized to mean structural expression, in paired rows to demonstrate consistency between the two brains. b, Gene-clustered topographic representation of the 74 most differentially expressed genes in human PSD preparations. Gene profiles represent average expression in each structure between brains, plotted as deviation from the median. Clusters correspond to selective spatial enrichment of genes related to synaptic function, as well as an oligodendrocyte-enriched gene cluster (front cluster).
Figure 3
Figure 3. Global gene networks
a, Cluster dendrogram groups genes into distinct modules using all samples in Brain 1, with the y axis corresponding to co-expression distance between genes and the x axis to genes (Supplementary Methods 2). b, Top colour band: colour-coded gene modules. Second band: genes enriched in different cell types (400 genes per cell type) selectively overlap specific modules. Turquoise, neurons; yellow, oligodendrocytes; purple, astrocytes; white, microglia. Third band: correlation of expression across 170 subregions between the two brains. Red corresponds to positive correlations and white to no significant correlation. Fourth band: strong preservation of modules between Brain 1 and Brain 2, measured using aZ-score summary (Z ≥ 10 indicates significant preservation). Fifth band: cortical (red) versus subcortical (green) enrichment (one-side t-test). c, Module eigengene expression (y axis) is shown for eight modules across 170 subregions with standard error. Dotted lines delineate major regions (see Supplementary Table 2 for structure abbreviations). An asterisk marks regions of interest. Module eigengene classifiers are based on structural expression pattern, putative cell type and significant GO terms. Selected hub genes are shown.
Figure 4
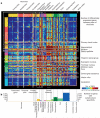
Figure 4. Structural variation in gene expression
a, Matrix of differential expression between 146 regions in both brains. Each point represents the number of common genes enriched in one structure over another in both brains (BH-corrected P < 0.01, log2[fold change] > 1.5). DEG, differentially expressed genes. Several major regions exhibit relatively low internal variation (blue), including the neocortex, cerebellum, dorsal thalamus and amygdala. Subcortical regions show highly complex differential patterns between specific nuclei. b, Frequency of marker genes with selective expression in specific subdivisions of major brain regions (greater than twofold enrichment in a particular subdivision compared to the remaining subdivisions).
Figure 5
Figure 5. Distinct transcriptional profiles of hippocampal subfields and human-specific pattern of CALB1 expression
a, 2D clustering of microarray samples and differentially expressed genes across hippocampal subdivisions (ANOVA, P < 0.01 BH-corrected, top 5,000 genes), with selected enriched GO terms. b, Microarray data for CALB1 shows enrichment in the dentate gyrus (DG) in both brains (y axis shows normalized raw microarray values). S, subiculum. c, Nissl (left) and CALB1 ISH (right) through adult human hippocampus confirms dentate-gyrus-selective expression. d, e, Unlike human, CALB1 ISH in the adult mouse (d) and rhesus macaque (e) show high CALB1 expression in CA1 and CA2 (arrows) in addition to dentate gyrus. Scale bars: 1 mm.
Figure 6
Figure 6. The neocortical transcriptome reflects primary sensorimotor specialization and in vivo spatial topography
a-c, First three neocortical principal components, plotted across 57 cortical divisions ordered roughly rostral to caudal (frontal to occipital pole), are highly reproducible between brains. PC1 (Pearson r = 0.71) is selective for primary sensory and motor areas (a). PC2 (Pearson r = 0.51) is differential for specific subdivisions of the frontal, temporal and occipital poles (b), whereas PC3 (Pearson r = 0.70) is selective for the caudal portion of the frontal lobe (c). d, e, Relationship between the (x, y, z) location of sampled cortical gyri and their transcriptional similarities. Native Brain 1 MRI is shown in d with major gyri labelled (Supplementary Table 2). e, MDS applied to the same cortical samples, where distance between points reflects similarity in gene expression profiles. Median samples for major gyri are labelled. Samples cluster by lobe, and both lobe positions and gyral positions generally mirror the native spatial topography, emphasized by arrows in d and e. Inset panel in e plots the relationship (mean ± 1 s.d.) between 3D MDS-based similarity and 3D in vivo sample distance, demonstrating correlations that are stronger between proximal samples and decrease with distance. Selected gyral pairs are labelled. See Supplementary Table 2 for cortical gyrus abbreviations.

Comment in

Similar articles

  • Transcriptional landscape of the prenatal human brain.
    Miller JA, Ding SL, Sunkin SM, Smith KA, Ng L, Szafer A, Ebbert A, Riley ZL, Royall JJ, Aiona K, Arnold JM, Bennet C, Bertagnolli D, Brouner K, Butler S, Caldejon S, Carey A, Cuhaciyan C, Dalley RA, Dee N, Dolbeare TA, Facer BA, Feng D, Fliss TP, Gee G, Goldy J, Gourley L, Gregor BW, Gu G, Howard RE, Jochim JM, Kuan CL, Lau C, Lee CK, Lee F, Lemon TA, Lesnar P, McMurray B, Mastan N, Mosqueda N, Naluai-Cecchini T, Ngo NK, Nyhus J, Oldre A, Olson E, Parente J, Parker PD, Parry SE, Stevens A, Pletikos M, Reding M, Roll K, Sandman D, Sarreal M, Shapouri S, Shapovalova NV, Shen EH, Sjoquist N, Slaughterbeck CR, Smith M, Sodt AJ, Williams D, Zöllei L, Fischl B, Gerstein MB, Geschwind DH, Glass IA, Hawrylycz MJ, Hevner RF, Huang H, Jones AR, Knowles JA, Levitt P, Phillips JW, Sestan N, Wohnoutka P, Dang C, Bernard A, Hohmann JG, Lein ES. Miller JA, et al. Nature. 2014 Apr 10;508(7495):199-206. doi: 10.1038/nature13185. Epub 2014 Apr 2. Nature. 2014. PMID: 24695229 Free PMC article.
  • Transcriptional architecture of the primate neocortex.
    Bernard A, Lubbers LS, Tanis KQ, Luo R, Podtelezhnikov AA, Finney EM, McWhorter MM, Serikawa K, Lemon T, Morgan R, Copeland C, Smith K, Cullen V, Davis-Turak J, Lee CK, Sunkin SM, Loboda AP, Levine DM, Stone DJ, Hawrylycz MJ, Roberts CJ, Jones AR, Geschwind DH, Lein ES. Bernard A, et al. Neuron. 2012 Mar 22;73(6):1083-99. doi: 10.1016/j.neuron.2012.03.002. Epub 2012 Mar 21. Neuron. 2012. PMID: 22445337 Free PMC article.
  • The Allen Human Brain Atlas: comprehensive gene expression mapping of the human brain.
    Shen EH, Overly CC, Jones AR. Shen EH, et al. Trends Neurosci. 2012 Dec;35(12):711-4. doi: 10.1016/j.tins.2012.09.005. Epub 2012 Oct 5. Trends Neurosci. 2012. PMID: 23041053
  • Cellular distribution of the calcium-binding proteins parvalbumin, calbindin, and calretinin in the neocortex of mammals: phylogenetic and developmental patterns.
    Hof PR, Glezer II, Condé F, Flagg RA, Rubin MB, Nimchinsky EA, Vogt Weisenhorn DM. Hof PR, et al. J Chem Neuroanat. 1999 Feb;16(2):77-116. doi: 10.1016/s0891-0618(98)00065-9. J Chem Neuroanat. 1999. PMID: 10223310 Review.
  • Brain transcriptome atlases: a computational perspective.
    Mahfouz A, Huisman SMH, Lelieveldt BPF, Reinders MJT. Mahfouz A, et al. Brain Struct Funct. 2017 May;222(4):1557-1580. doi: 10.1007/s00429-016-1338-2. Epub 2016 Dec 1. Brain Struct Funct. 2017. PMID: 27909802 Free PMC article. Review.

Cited by

References

    1. Lein ES, et al. Genome-wide atlas of gene expression in the adult mouse brain. Nature. 2007;445:168–176. - PubMed
    1. Diez-Roux G, et al. A high-resolution anatomical atlas of the transcriptome in the mouse embryo. PLoS Biol. 2011;9:e1000582. - PMC - PubMed
    1. Baldock RA, et al. EMAP and EMAGE: a framework for understanding spatially organized data. Neuroinformatics. 2003;1:309–325. - PubMed
    1. Kang HJ, et al. Spatio-temporal transcriptome of the human brain. Nature. 2011;478:483–489. - PMC - PubMed
    1. Colantuoni C, et al. Temporal dynamics and genetic control of transcription in the human prefrontal cortex. Nature. 2011;478:519–523. - PMC - PubMed

Publication types

MeSH terms