Analyzing the spatial and temporal distribution of human brucellosis in Azerbaijan (1995 - 2009) using spatial and spatio-temporal statistics
- PMID: 22873196
- PMCID: PMC3482564
- DOI: 10.1186/1471-2334-12-185
Analyzing the spatial and temporal distribution of human brucellosis in Azerbaijan (1995 - 2009) using spatial and spatio-temporal statistics
Abstract
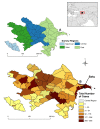
Background: Human brucellosis represents a significant burden to public and veterinary health globally, including the republic of Azerbaijan. The purpose of this study was to examine and describe the spatial and temporal aspects of the epidemiology of human brucellosis in Azerbaijan from 1995 to 2009.
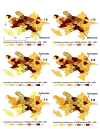
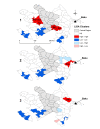
Methods: A Geographic information system (GIS) was used to identify potential changes in the spatial and temporal distribution of human brucellosis in Azerbaijan during the study period. Epidemiological information on the age, gender, date, and location of incident cases were obtained from disease registries housed at the Republican Anti-Plague station in Baku. Cumulative incidences per 100,000 populations were calculated at the district level for three, 5-year periods. Spatial and temporal cluster analyses were performed using the Local Moran's I and the Ederer-Myer-Mantel (EMM) test.
Results: A total of 7,983 cases of human brucellosis were reported during the 15-year study period. Statistically significant spatial clusters were identified in each of three, five year time periods with cumulative incidence rates ranging from 101.1 (95% CI: 82.8, 124.3) to 203.0 (95% CI; 176.4, 234.8). Spatial clustering was predominant in the west early in the study during period 1 and then in the east during periods 2 and 3. The EMM test identified a greater number of statistically significant temporal clusters in period 1 (1995 to 1999).
Conclusion: These results suggest that human brucellosis persisted annually in Azerbaijan across the study period. The current situation necessitates the development of appropriate surveillance aimed at improving control and mitigation strategies in order to help alleviate the current burden of disease on the population. Areas of concern identified as clusters by the spatial-temporal statistical analyses can provide a starting point for implementing targeted intervention efforts.
Figures


Similar articles
-
Epidemiological characteristics and spatio-temporal clusters of human brucellosis in Inner Mongolia, 2010-2021.BMC Infect Dis. 2024 Nov 20;24(1):1321. doi: 10.1186/s12879-024-10165-x. BMC Infect Dis. 2024. PMID: 39567873 Free PMC article.
-
Human distribution and spatial-temporal clustering analysis of human brucellosis in China from 2012 to 2016.Infect Dis Poverty. 2020 Oct 13;9(1):142. doi: 10.1186/s40249-020-00754-8. Infect Dis Poverty. 2020. PMID: 33050950 Free PMC article.
-
Spatial and spatio-temporal analysis of human brucellosis in Iran.Trans R Soc Trop Med Hyg. 2014 Nov;108(11):721-8. doi: 10.1093/trstmh/tru133. Epub 2014 Aug 25. Trans R Soc Trop Med Hyg. 2014. PMID: 25157126
-
Human Brucellosis Trends: Re-emergence and Prospects for Control Using a One Health Approach in Azerbaijan (1983-2009).Zoonoses Public Health. 2016 Jun;63(4):294-302. doi: 10.1111/zph.12229. Epub 2015 Sep 25. Zoonoses Public Health. 2016. PMID: 26403990
-
Geographic information system-based analysis of the spatial and spatio-temporal distribution of zoonotic cutaneous leishmaniasis in Golestan Province, north-east of Iran.Zoonoses Public Health. 2015 Feb;62(1):18-28. doi: 10.1111/zph.12109. Epub 2014 Mar 17. Zoonoses Public Health. 2015. PMID: 24628913
Cited by
-
Identification and molecular characterization of Brucella abortus and Brucella melitensis isolated from milk in cattle in Azerbaijan.BMC Vet Res. 2022 Feb 15;18(1):71. doi: 10.1186/s12917-022-03155-1. BMC Vet Res. 2022. PMID: 35168621 Free PMC article.
-
Brucellar Epididymo-Orchitis in a Brucellosis Hyperendemic Region in Türkiye.Infect Dis Clin Microbiol. 2023 Dec 29;5(4):367-375. doi: 10.36519/idcm.2023.253. eCollection 2023 Dec. Infect Dis Clin Microbiol. 2023. PMID: 38633857 Free PMC article.
-
Spatial analysis on human brucellosis incidence in mainland China: 2004-2010.BMJ Open. 2014 Apr 8;4(4):e004470. doi: 10.1136/bmjopen-2013-004470. BMJ Open. 2014. PMID: 24713215 Free PMC article.
-
Spatial Distribution and Epidemiological Factors of Brucellosis in Ardabil Province, Iran.Health Serv Res Manag Epidemiol. 2023 Nov 8;10:23333928231211412. doi: 10.1177/23333928231211412. eCollection 2023 Jan-Dec. Health Serv Res Manag Epidemiol. 2023. PMID: 37954480 Free PMC article.
-
Brucellosis in low-income and middle-income countries.Curr Opin Infect Dis. 2013 Oct;26(5):404-12. doi: 10.1097/QCO.0b013e3283638104. Curr Opin Infect Dis. 2013. PMID: 23963260 Free PMC article. Review.
References
-
- Benkirane A. Ovine and caprine brucellosis: World distribution and control/eradication strategies in West Asia/North Africa region. Small Ruminant Res. 2006;62:19–25. doi: 10.1016/j.smallrumres.2005.07.032. - DOI
-
- Doganay M, Aygen B. Human brucellosis: an overview. Int J Infect Dis. 2003;7:173–182. doi: 10.1016/S1201-9712(03)90049-X. - DOI
Publication types
MeSH terms
Grants and funding
LinkOut - more resources
Full Text Sources

