The mechanism of orientation selectivity in primary visual cortex without a functional map - PubMed Skip to main page content
U.S. flag

An official website of the United States government

Dot gov

The .gov means it’s official.
Federal government websites often end in .gov or .mil. Before sharing sensitive information, make sure you’re on a federal government site.

Https

The site is secure.
The https:// ensures that you are connecting to the official website and that any information you provide is encrypted and transmitted securely.

Access keys NCBI Homepage MyNCBI Homepage Main Content Main Navigation
. 2012 Mar 21;32(12):4049-64.
doi: 10.1523/JNEUROSCI.6284-11.2012.

The mechanism of orientation selectivity in primary visual cortex without a functional map

Affiliations

The mechanism of orientation selectivity in primary visual cortex without a functional map

David Hansel et al. J Neurosci. .

Abstract

Neurons in primary visual cortex (V1) display substantial orientation selectivity even in species where V1 lacks an orientation map, such as in mice and rats. The mechanism underlying orientation selectivity in V1 with such a salt-and-pepper organization is unknown; it is unclear whether a connectivity that depends on feature similarity is required, or a random connectivity suffices. Here we argue for the latter. We study the response to a drifting grating of a network model of layer 2/3 with random recurrent connectivity and feedforward input from layer 4 neurons with random preferred orientations. We show that even though the total feedforward and total recurrent excitatory and inhibitory inputs all have a very weak orientation selectivity, strong selectivity emerges in the neuronal spike responses if the network operates in the balanced excitation/inhibition regime. This is because in this regime the (large) untuned components in the excitatory and inhibitory contributions approximately cancel. As a result the untuned part of the input into a neuron as well as its modulation with orientation and time all have a size comparable to the neuronal threshold. However, the tuning of the F0 and F1 components of the input are uncorrelated and the high-frequency fluctuations are not tuned. This is reflected in the subthreshold voltage response. Remarkably, due to the nonlinear voltage-firing rate transfer function, the preferred orientation of the F0 and F1 components of the spike response are highly correlated.


Figures

Figure 1.
Figure 1.
Single neuron dynamics and properties of recurrent and feedforward inputs in the model. A, B, Action potentials of an excitatory and an inhibitory neuron, respectively. C, D, Unitary EPSPs (C) and IPSPs (D). The traces in red and blue correspond to excitatory and inhibitory postsynaptic neurons, respectively. The PSPs are faster when the postsynaptic neuron is inhibitory. This is because inhibitory neurons have a larger leak conductance and thus a shorter membrane time constant than excitatory neurons.
Figure 2.
Figure 2.
Schematic representation of the time-averaged feedforward conductance. Kff layer 4 neurons with random PO (left column) are connected to a layer 2/3 neuron. The total feedforward conductance, averaged over orientation (middle, green) is the product of the synaptic conductance, g≡ḡffA., the average firing rate Rave = R0ff + R1ff(C), and Kff. The total conductance (red) is very weakly modulated with orientation. The typical amplitude of the modulation is on the order of Kff (right). Thus even when the individual layer 4 neurons are sharply tuned, the total feedforward conductance will have very weak tuning.
Figure 3.
Figure 3.
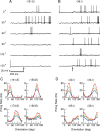
The response of the neurons is orientation selective. A, B, Traces of the membrane potential of an excitatory (A) and an inhibitory (B) neuron for a stimulus with contrast level, C = 30%, presented at 250 ms (arrow) at six orientations. C, D, Tuning curves of four excitatory (C) and four inhibitory (D) neurons at 10% contrast (blue), 30% contrast (green), and 100% contrast (red). The stimulus was presented at 18 orientations (every 10°). For each presentation, the firing rate was estimated from the spike response averaged over 25 s. The neurons in the upper left in C and lower right in D are the same as those in A and B. For parameters see Materials and Methods.
Figure 4.
Figure 4.
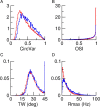
Diversity of spike response properties. A, Distribution of the circular variance, CircVar. Average CircVar are 0.42 and 0.48 for the excitatory and inhibitory populations, respectively. B, Distribution of the OSI. Average OSIs are 0.85 and 0.78 for excitatory and inhibitory populations. C, Distribution of the TW (see Eq. 24). D, Distribution of the maximum firing rate, Rmax. A–D, Excitatory population in red; inhibitory population in blue. All the histograms were computed from the responses of the neurons to a stimulus with a 30% contrast, presented at 18 orientations (every 10°), for 25 s. Rmax was computed as the largest firing rate out of the responses at the 18 orientations. In A, B, D all neurons are included. Only neurons with a tuning curve well fitted to a Von Mises function are included in C.
Figure 5.
Figure 5.
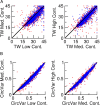
Contrast invariance of the tuning of the spike response of the neurons. The stimulus was presented at 3 contrast levels: low, C = 10%; medium, C = 30%; high, C = 100%. A, Scatter plots of the TW at different contrasts. Two thousand excitatory (red) and 2000 inhibitory (blue) neurons chosen at random among those for which the tuning curve is well fitted by a Von Mises function are included. B, Scatter plots of the CircVar at three contrasts for 2000 excitatory (red) and 2000 inhibitory (blue) neurons chosen at random.
Figure 6.
Figure 6.
Neurons integrate inputs coming from cells with all tuning properties. A, Center, The spike tuning curve of neuron (71, E). Red (resp. blue) are the tuning curves of a sample of four excitatory (resp. inhibitory) neurons presynaptic to neuron (71, E). Both PO and selectivity are diverse. B, Histograms of the POs of all excitatory (red) and inhibitory (blue) neurons presynaptic to neuron (71, E). Black, Excitatory and inhibitory presynaptic neurons. C, Distributions of the CircVar of all excitatory (red) and all inhibitory (blue) neurons presynaptic to neuron (71, E). Black, The distribution over all the neurons in the network. Note the similarity of the distributions. The stimulus contrast is C = 30%.
Figure 7.
Figure 7.
The network is in a balanced state. A, Voltage traces of neuron (3, E) (the tuning curve of this neuron is plotted in Fig. 8C). A visual stimulation (30% contrast) is presented at t = 125 ms, at PO (red) and orthogonal orientation (black). B, Voltage traces of neuron (3, E) under the same stimulation conditions but with the spikes blocked (gNa = 0). C, D, The excitatory current (red), inhibitory current (blue), and total synaptic current (black) into neuron (3, E) under the same stimulation conditions. In (C) the stimulus is at the PO of the neuron. In (D) it is at the orthogonal orientation. During stimulation the excitatory and inhibitory currents are large: at PO the mean excitatory and inhibitory currents are 13.5 and − 12.8 mA/cm2, respectively. At the orthogonal orientation they are 10.4 and − 10.4 mA/cm2. The mean total currents are much smaller: 0.7 and 0 · mA/cm2 at the preferred and orthogonal orientations, respectively. Before stimulation the currents are smaller: the mean excitatory and inhibitory currents are 2.7 mA/cm2 and − 2.6 mA/cm2, respectively. E–H, The same as in A–D for inhibitory neuron (98, I) (the tuning curve of this neuron is plotted in Fig. 8D). Without stimulus: mean currents are 4.4 mA/cm2 (excitation), − 4 mA/cm2 (inhibition), and 0.4 mA/cm2 (total). For a stimulus at PO they are 20.3 mA/cm2 (excitation), − 19 mA/cm2 (inhibition), and 1.3 mA/cm2 (total). For a stimulus at the orthogonal orientation: 18.2 mA/cm2 (excitation), − 17.8 mA/cm2 (inhibition), and 0.4 mA/cm2 (total). I, Distributions of the coefficient of variations (CV) of the interspike interval histograms with a stimulus with a 30% contrast (one orientation). Red. excitatory neurons; blue, inhibitory neurons. For each neuron the CV was computed from spike trains of 25 s in duration. Only neurons firing >10 spikes during the trial (74% of the excitatory neurons, 88% of the inhibitory neurons) were included in these distributions.
Figure 8.
Figure 8.
Tuning properties of the membrane potential of the neurons. The stimulus has 30% contrast. A–C, Tuning curves of the spikes for neurons (3, E), (98, I), and (33, E). D–F, Tuning curves of the time averaged membrane potential (black) and of the SD of the voltage fluctuations (red) for the same neurons as in A–C. The voltage is measured relatively to the average membrane potential without stimulation.
Figure 9.
Figure 9.
Orientation selectivity is robust with respect to changes in the synaptic conductances. The contrast is 30%. A–C, the distributions of CircVar are plotted in black for the default case. The average firing rates in that case are: 4.6 Hz for the excitatory population and 7.8 Hz for the inhibitory one. The upper and lower parts correspond to excitatory and inhibitory neurons. A, Red, the distributions of CircVar are plotted for an increase of GEE by 10%. The population average firing rates are 5 and 8 Hz for the excitatory and the inhibitory populations. B, Red, the distributions of CircVar are plotted for an increase of GII by 10%. The average firing rates are 7.3 and 8.3 Hz for the excitatory and the inhibitory populations, respectively. C, Multiplying all the conductances by the same factor, Q, has only a minor effect on the average firing rates (see text) and on the distributions of CircVar. Green, Q = 2; red: Q = 4.
Figure 10.
Figure 10.
The selectivity of the neurons in layer 2/3 depends crucially on the tuning amplitude (ξA) of the feedforward inputs from layer 4. The contrast is C = 30%. A, Distributions for the default case ξE = ξI = 1.2 (black), ξE = ξI = 0.8 (green), and ξE = ξI = 0.4 (red). B, Distributions of CircVar for ξE = 1.2 and ξI = 0. The population averages are 0.45 and 0.89 for excitatory and inhibitory neurons respectively. C, Histograms of the OSI for ξE = 1.2 and ξI = 0. The average OSI is 0.84 for excitatory neurons and 0.22 for inhibitory ones. B, C, Histograms for excitatory neurons are in red and those for the inhibitory ones in blue.
Figure 11.
Figure 11.
The degree of orientation selectivity is almost independent of the connectivity and of the footprint of the interactions. Black, Default case. A, Multiplying the connectivity, K, by a factor of 2 (red) has only a minor effect on the distribution of CircVar. B, The distribution of CircVar in a network in which the probability of connectivity is independent of the distance (red) is very slightly different from the one in the default case (σ = L/5).
Figure 12.
Figure 12.
Response of neuron (3, E) in the model with simple cells in layer 4. A, Trace of the membrane potential when a drifting grating with contrast 30% and temporal frequency 2 Hz is presented from t = 500 ms. The spikes were cut at −20 mV. B, Total excitatory (red), total inhibitory (blue), and net (black) input into neuron (3, E) when gNa = 0. C, Orientation tuning curves of the F0 (black) and F1 (red) component of the spike response. D, Orientation tuning curves of the F0 (black) and F1 (red) component of the membrane potential when the spikes are suppressed. The mean voltage is measured relative to the average potential of the neuron without stimulus.
Figure 13.
Figure 13.
Response of neuron (13, I) in the model with simple cells in layer 4. A, Trace of the membrane potential when a drifting grating with contrast 30% and temporal frequency 2 Hz is presented from t = 500 ms. The spikes were cut at −20 mV. B, Total excitatory (red), total inhibitory (blue), and net (black) input into neuron (3, E) when gNa = 0. C, Orientation tuning curves of the F0 (black) and F1 (red) component of the spike response. D, Orientation tuning curves of the F0 (black) and F1 (red) component of the membrane potential when the spikes are suppressed. The mean voltage is measured relative to the average potential of the neuron without stimulus.
Figure 14.
Figure 14.
Tuning properties of the spike response for the excitatory population in the model with simple cell inputs. A, Distribution of the CircVar for the F0 (black) and F1 (red) component of the response. B, Distribution of the ratio of F1/F0. C, Distribution of the difference in PO of the F0 and F1 components of the spikes response. D, Scatterplot of the CircVar of the F0 component versus the CircVar of the F1 component.
Figure 15.
Figure 15.
Properties of the voltage response of the excitatory population and its relation to the spike response. A, Scatter plot of the POs of the F0 (V0) and the F1 (V1) components of the voltage showing no correlations. B, Amplitude of the modulation with orientation of the F1 component (V1) plotted against that of the F0 component (V0) of the voltage. There is no correlation for this measure either. C, Scatter plot of the PO of the F0 component of the firing rate versus the PO of the F0 component of the membrane potential. D, Scatterplot of the PO of the F1 component of the firing rate versus the PO of the F0 component of the membrane potential. The PO of both the F0 and F1 components of the spike response are highly correlated with the PO of the F0 component of the membrane potential. For both, the correlation with the PO of the F1 component of the membrane potential is not significant (data not shown).

Comment in

Similar articles

Cited by

References

    1. Anderson JS, Lampl I, Gillespie DC, Ferster D. The contribution of noise to contrast invariance of orientation tuning in cat visual cortex. Science. 2000a;290:1968–1972. - PubMed
    1. Anderson JS, Lampl I, Reichova I, Carandini M, Ferster D. Stimulus dependence of two-state fluctuations of membrane potential in cat visual cortex. Nat Neurosci. 2000b;3:617–621. - PubMed
    1. Ben-Yishai R, Lev Bar-Or RL, Sompolinsky H. Theory of orientation tuning in visual cortex. Proc Natl Acad Sci U S A. 1995;92:3844–3848. - PMC - PubMed
    1. Blasdel GG, Salama G. Voltage-sensitive dyes reveal a modular organization in monkey striate cortex. Nature. 1986;321:579–585. - PubMed
    1. Bonhoeffer T, Grinvald A. Iso-orientation domains in cat visual cortex are arranged in pinwheel-like patterns. Nature. 1991;353:429–431. - PubMed