Applications of remote sensing to alien invasive plant studies
- PMID: 22408558
- PMCID: PMC3291943
- DOI: 10.3390/s90604869
Applications of remote sensing to alien invasive plant studies
Abstract
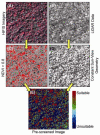
Biological invasions can affect ecosystems across a wide spectrum of bioclimatic conditions. Therefore, it is often important to systematically monitor the spread of species over a broad region. Remote sensing has been an important tool for large-scale ecological studies in the past three decades, but it was not commonly used to study alien invasive plants until the mid 1990s. We synthesize previous research efforts on remote sensing of invasive plants from spatial, temporal and spectral perspectives. We also highlight a recently developed state-of-the-art image fusion technique that integrates passive and active energies concurrently collected by an imaging spectrometer and a scanning-waveform light detection and ranging (LiDAR) system, respectively. This approach provides a means to detect the structure and functional properties of invasive plants of different canopy levels. Finally, we summarize regional studies of biological invasions using remote sensing, discuss the limitations of remote sensing approaches, and highlight current research needs and future directions.
Keywords: biological invasions; high spatial resolution; high temporal resolution; hyperspectral remote sensing; image fusion; light detection and ranging (LiDAR); moderate spatial/spectral resolution.
Figures


Similar articles
-
Mapping multi-scale vascular plant richness in a forest landscape with integrated LiDAR and hyperspectral remote-sensing.Ecology. 2018 Feb;99(2):474-487. doi: 10.1002/ecy.2109. Ecology. 2018. PMID: 29231965
-
Managing plant invasions through the lens of remote sensing: A review of progress and the way forward.Sci Total Environ. 2018 Nov 15;642:1328-1339. doi: 10.1016/j.scitotenv.2018.06.134. Epub 2018 Jun 20. Sci Total Environ. 2018. PMID: 30045513 Review.
-
Fusion neural networks for plant classification: learning to combine RGB, hyperspectral, and lidar data.PeerJ. 2021 Jul 29;9:e11790. doi: 10.7717/peerj.11790. eCollection 2021. PeerJ. 2021. PMID: 34395073 Free PMC article.
-
Hyperspectral and LiDAR remote sensing of fire fuels in Hawaii Volcanoes National Park.Ecol Appl. 2008 Apr;18(3):613-23. doi: 10.1890/07-1280.1. Ecol Appl. 2008. PMID: 18488621
-
A Review of Wetland Remote Sensing.Sensors (Basel). 2017 Apr 5;17(4):777. doi: 10.3390/s17040777. Sensors (Basel). 2017. PMID: 28379174 Free PMC article. Review.
Cited by
-
Options for monitoring and estimating historical carbon emissions from forest degradation in the context of REDD+.Carbon Balance Manag. 2011 Nov 24;6(1):13. doi: 10.1186/1750-0680-6-13. Carbon Balance Manag. 2011. PMID: 22115360 Free PMC article.
-
Camera Assisted Roadside Monitoring for Invasive Alien Plant Species Using Deep Learning.Sensors (Basel). 2021 Sep 13;21(18):6126. doi: 10.3390/s21186126. Sensors (Basel). 2021. PMID: 34577335 Free PMC article.
-
Invasive Shrub Mapping in an Urban Environment from Hyperspectral and LiDAR-Derived Attributes.Front Plant Sci. 2016 Oct 21;7:1528. doi: 10.3389/fpls.2016.01528. eCollection 2016. Front Plant Sci. 2016. PMID: 27818664 Free PMC article.
-
Novel fine-scale aerial mapping approach quantifies grassland weed cover dynamics and response to management.PLoS One. 2017 Oct 9;12(10):e0181665. doi: 10.1371/journal.pone.0181665. eCollection 2017. PLoS One. 2017. PMID: 29016604 Free PMC article.
-
Fluorescence and Hyperspectral Sensors for Nondestructive Analysis and Prediction of Biophysical Compounds in the Green and Purple Leaves of Tradescantia Plants.Sensors (Basel). 2024 Oct 9;24(19):6490. doi: 10.3390/s24196490. Sensors (Basel). 2024. PMID: 39409529 Free PMC article.
References
-
- Parry M.L., Canziani O.F., Palutikof J.P., et al. 2007: Technical Summary. In: Parry M.L., Canziani O.F., Palutikof J.P., van der Linden P.J., Hanson C.E., editors. Climate Change 2007: Impacts, Adaptation and Vulnerability. Cambridge University Press; Cambridge, UK: 2007. pp. 23–78. Contribution of Working Group II to the Fourth Assessment Report of the Intergovernmental Panel on Climate Change.
-
- Beck K.G., Zimmerman K., Schardt J.D., Stone J., Lukens R.R., Reichard S., Randall J., Cangelosi A.A., Cooper D., Thompson J.P. Invasive species defined in a policy context: Recommendations from the Federal Invasive Species Advisory Committee. Invasive Plant Sci. Manage. 2008;1:414–421.
-
- Pimentel D., Lach L., Zuniga R., Morrison D. Environmental and economic costs of nonindigenous species in the United States. BioScience. 2000;50:53–65.
-
- Vitousek P.M. Biological invasions and ecosystem processes: towards an integration of population biology and ecosystem studies. Oikos. 1990;57:7–13.
-
- D'Antonio C.M., Vitousek P.M. Biological invasions by exotic grasses, the grass/fire cycle, and global change. A. Rev. Ecol. Syst. 1992;23:63–87.
LinkOut - more resources
Full Text Sources
Miscellaneous

