fMRI-DTI modeling via landmark distance atlases for prediction and detection of fiber tracts - PubMed Skip to main page content
U.S. flag

An official website of the United States government

Dot gov

The .gov means it’s official.
Federal government websites often end in .gov or .mil. Before sharing sensitive information, make sure you’re on a federal government site.

Https

The site is secure.
The https:// ensures that you are connecting to the official website and that any information you provide is encrypted and transmitted securely.

Access keys NCBI Homepage MyNCBI Homepage Main Content Main Navigation
. 2012 Mar;60(1):456-70.
doi: 10.1016/j.neuroimage.2011.11.014. Epub 2011 Dec 2.

fMRI-DTI modeling via landmark distance atlases for prediction and detection of fiber tracts

Affiliations

fMRI-DTI modeling via landmark distance atlases for prediction and detection of fiber tracts

Lauren J O'Donnell et al. Neuroimage. 2012 Mar.

Abstract

The overall goal of this research is the design of statistical atlas models that can be created from normal subjects, but may generalize to be applicable to abnormal brains. We present a new style of joint modeling of fMRI, DTI, and structural MRI. Motivated by the fact that a white matter tract and related cortical areas are likely to displace together in the presence of a mass lesion (brain tumor), in this work we propose a rotation and translation invariant model that represents the spatial relationship between fiber tracts and anatomic and functional landmarks. This landmark distance model provides a new basis for representation of fiber tracts and can be used for detection and prediction of fiber tracts based on landmarks. Our results indicate that the measured model is consistent across normal subjects, and thus suitable for atlas building. Our experiments demonstrate that the model is robust to displacement and missing data, and can be successfully applied to a small group of patients with mass lesions.


Figures

Fig. 1
Fig. 1
Anatomical landmarks (corpus callosum, anterior commisure, and cerebral peduncle) and functional landmarks (motor, language, and visual activation peaks) from control subject 1. Arrows label each landmark with its acronym (see Tables 1 and 2). Spheres centered at each landmark have been annotated with stars to improve visibility.
Fig. 2
Fig. 2
Input dataset from 5 subjects including arcuate fasciculus (AF, light blue); left and right corticospinal tracts (CST, dark blue); and fMRI activation peaks plus anatomic landmarks (spheres).
Fig. 3
Fig. 3
A 2D example demonstrating measurement of the LD model for a single fiber and a single landmark. The fiber is represented by a fixed number of points along the trajectory (6 points in this example, P1 to P6), then distances (arrows labeled LD) are measured from each point to the landmark.
Fig. 4
Fig. 4
Method for fiber prediction based on the LD model. Estimation of a point’s coordinates based on its distance from 3 or more other points is called trilateration and is used in GPS systems. The desired distance from each input landmark point (L1–L4) gives the radius of each dashed circle. The circles converge on a black point that is the correct distance from all landmark points. We use this method to estimate the locations of points along a fiber trajectory, based on the given landmark locations and distances in the LD model.
Fig. 5
Fig. 5
Measurement of landmark distances (LD) in subject 1, between left arcuate (AF) and nearby and distant landmarks. The plots on the right show LD measurements (dashed gray lines) from every fiber in the AF (shown at left in light blue), plus the mean LD in the whole structure (solid black line). LD measurements for each landmark are shown in a separate plot, with nearby landmarks in the top row. In each plot, the horizontal axis represents fiber arc length (30 points along each fiber trajectory) while the vertical axis displays LD in mm.
Fig. 6
Fig. 6
Good correspondence across normal subjects is demonstrated by measurement of landmark distances (LD) from left arcuate to nearby and distant landmarks. The plots on the right show LD measurements along the tract for all subjects. Each landmark is shown in a separate plot, with nearby landmarks in the top row. The colors indicate subject number (1 to 5). In each plot, the horizontal axis represents fiber arc length (30 points along each fiber trajectory) while the vertical axis displays LD in mm. The vertical bars represent the standard deviation of LD within each subject (across multiple fibers).
Fig. 7
Fig. 7
Good correspondence across normal subjects is demonstrated by measurement of landmark distances (LD) from left corticospinal tract to nearby and distant landmarks. The plots on the right show LD measurements along the tract for all subjects. Each landmark is shown in a separate plot, with nearby landmarks in the top row. The colors indicate subject number (1 to 5). In each plot, the horizontal axis represents fiber arc length (30 points along each fiber trajectory) while the vertical axis displays LD in mm. The vertical bars represent the standard deviation of LD within each subject (across multiple fibers).
Fig. 8
Fig. 8
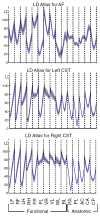
Concatenation of landmark distance information from all landmarks (previous figures) produces a single feature vector representing all LD measurements. Summarizing this information across subjects gives an LD atlas (LDA). Here, the across-subjects componentwise mean (solid blue curve) and standard deviation (gray) of the LD feature vectors are shown. The horizontal axes are labeled by anatomic and functional landmarks (for each landmark, 30 landmark distances are plotted, from points along the entire arc length of the tract). See Tables 1 and 2 for landmark acronym definitions. The vertical axes represent LD in mm. The dashed lines separate information from different landmarks (note these LDAs are not truly continuous curves, the dashed lines separate essentially unrelated datapoints that are connected by “jumps” or vertical lines due to the plotting).
Fig. 9
Fig. 9
Each sample from a PCA model of the RD atlas (each curve plotted on the left) is used to predict one fiber (one trajectory on the right), via trilateration. The additional information needed to predict the fiber (landmark locations) is not displayed. This figure depicts the first mode of variation, up to ± 1 standard deviation (68% confidence interval). For simplicity, only the first mode of variation is shown, however three modes of variation were used to give the results in Fig. 10.
Fig. 10
Fig. 10
Leave-one-out prediction of tract location according to the landmark distance atlas (LDA). Each subject’s fMRI activation peaks and anatomic landmarks, plus the leave-one-out LDA from the other subjects, were used to predict the location of the AF, left CST, and right CST. The true structures for each subject are shown in dark blue, and the 68% confidence interval for the predicted trajectory is shown in transparent cyan. These results provide an alternative visualization of the data in the learned landmark distance model and they demonstrate reasonable model generalization to novel subjects.
Fig. 11
Fig. 11
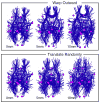
Datasets for leave-one-out testing of fiber detection with displacement. The left column (0 mm warp) shows original unwarped data from the test subject (subject 1). The two rightmost columns show synthetic data derived by applying displacements to the test subject’s data, as follows: The top row shows outward displacements of 5 mm and 10 mm applied to the tracts and landmarks (data were warped outward from an arbitrarily selected point in the left hemisphere). The bottom row shows random translations of whole fibers up to 5 mm and 10 mm along each axis (left–right, anterior–posterior, and superior–inferior). In each image, a random subset of 300 fibers is shown to reduce visual clutter.
Fig. 12
Fig. 12
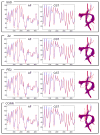
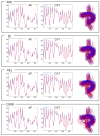
The LD model generalizes well to a test subject (subject 1) in this leave-one-out fiber detection experiment. The left two columns plot the leave-one-out AF and left CST LD atlases (blue) vs. the mean LD of detected tracts (red). The rightmost column shows the detected tracts (red) and the expected tracts (blue, from input data Fig. 2). Purple (red plus blue) indicates perfect overlap. All tested distance measures (in different rows) perform reasonably well and almost identically in this experiment (where no synthetic displacement was applied to the test subject).
Fig. 13
Fig. 13
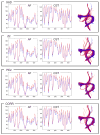
In this leave-one-out experiment the LD model generalizes well for detection of tracts warped 10 mm outward. The left two columns plot the AF and left CST LD atlases (blue) vs. the mean LD of detected tracts (red). The effect of this warp is shown in the fact that the red curve is higher in many places than the blue curve (expansion gives larger distances creating higher LD). The rightmost column shows the detected tracts (red) and the expected tracts (blue, from applying the warp to the known input tracts from Fig. 2). Purple (red plus blue) indicates perfect overlap. Comparison of detected warped tracts (right columns) indicates that performance of the PE2 and dCORR measures is best for this kind of displacement.
Fig. 14
Fig. 14
In this leave-one-out experiment the LD model generalizes well for detection of tracts randomly translated by up to 10 mm in each direction (x, y, z). The left two columns plot the AF and left CST LD atlases (blue) vs. the mean LD of detected tracts (red). The effect of this warp is not extremely visible in the mean LD curve (red), because averaging this curve over all detected fibers will tend to average out the random displacement effects. However, the expected and detected fibers (right column, in blue and red, respectively) show the effect of the warp. The top three rows’ measures perform reasonably, but the dCORR measure (bottom row) is more sensitive to this kind of displacement and erroneously detects some fibers not part of AF or CST.
Fig. 15
Fig. 15
Quality of tract detection measured as mean fiber similarity between detected and expected tracts (from Figs. 12-14). On left, summary of detection performance for each LD distance measure (Application of atlas: fiber tract detection with displacement section). On right, performance of each distance measure under each warp condition: 0 mm warp (no warp), 5 and 10 mm spherical outward warp, and 5 and 10 mm random translation. Over all experiments, the most robust performance is given by the dPE2 measure (solid circles in right graph). The dCORR measure also performs well, but its worst-case performance is worse than the dPE2 measure.
Fig. 16
Fig. 16
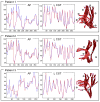
The LD model generalizes well for detection of tracts in surgical patients. The left two columns plot the AF and left CST LD atlases (blue) vs. the mean LD of detected tracts (red). The right column shows the detected structures for AF (light red) and CST (dark red). Note that missing landmark data is handled by using the corresponding subset of the atlas (all patients have fewer than 15 landmarks due to differing fMRI exams). In patients 1 and 3, the detection of the arcuate was partial due to tumor/edema near the arcuate (this can be seen in the left column’s dissimilar red and blue LD plots for AF as well as the detected tractography at right).
Fig. 17
Fig. 17
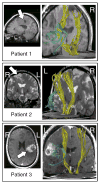
Relationship of detected AF and CST to mass lesions in patients. Left column, anatomical images showing tumor location (arrows). Right column, detected tracts, posterior oblique views. Lesions in patients 1 and 3 are located near the AF in the left hemisphere. The lesion in patient 2 is near the motor cortex, in the right hemisphere.

Similar articles

Cited by

References

    1. Catani M, de Schotten T. A diffusion tensor imaging tractography atlas for virtual in vivo dissections. Cortex. 2008;44(8):1105–1132. - PubMed
    1. Durrleman S, Fillard P, Pennec X, Trouvé A, Ayache N. A statistical model of white matter fiber bundles based on currents. In: Prince JL, Pham DL, Meyers KJ, editors. International Conference on Information Processing in Medical Imaging : Lecture Notes in Computer Science; Springer-Verlag; 2009. pp. 114–125. URL http://hal.inria.fr/inria-00502721/en/ - PubMed
    1. Fischl B, Salat D, Busa E, Albert M, Dieterich M, Haselgrove C, van der Kouwe A, Killiany R, Kennedy D, Klaveness S, et al. Whole brain segmentation: automated labeling of neuroanatomical structures in the human brain. Neuron. 2002;33(3):341–355. - PubMed
    1. Glasser MF, Rilling JK. DTI tractography of the human brain’s language pathways. Cereb Cortex. 2008;18(11):2471–2482. - PubMed
    1. Gong G, He Y, Concha L, Lebel C, Gross DW, Evans AC, Beaulieu C. Mapping anatomical connectivity patterns of human cerebral cortex using in vivo diffusion tensor imaging tractography. Cereb Cortex. 2009;19(3):524–536. - PMC - PubMed

Publication types