Beta-cell uncoupling protein 2 regulates reactive oxygen species production, which influences both insulin and glucagon secretion - PubMed Skip to main page content
U.S. flag

An official website of the United States government

Dot gov

The .gov means it’s official.
Federal government websites often end in .gov or .mil. Before sharing sensitive information, make sure you’re on a federal government site.

Https

The site is secure.
The https:// ensures that you are connecting to the official website and that any information you provide is encrypted and transmitted securely.

Access keys NCBI Homepage MyNCBI Homepage Main Content Main Navigation
. 2011 Nov;60(11):2710-9.
doi: 10.2337/db11-0132. Epub 2011 Oct 7.

Beta-cell uncoupling protein 2 regulates reactive oxygen species production, which influences both insulin and glucagon secretion

Affiliations

Beta-cell uncoupling protein 2 regulates reactive oxygen species production, which influences both insulin and glucagon secretion

Christine A Robson-Doucette et al. Diabetes. 2011 Nov.

Abstract

Objective: The role of uncoupling protein 2 (UCP2) in pancreatic β-cells is highly debated, partly because of the broad tissue distribution of UCP2 and thus limitations of whole-body UCP2 knockout mouse models. To investigate the function of UCP2 in the β-cell, β-cell-specific UCP2 knockout mice (UCP2BKO) were generated and characterized.

Research design and methods: UCP2BKO mice were generated by crossing loxUCP2 mice with mice expressing rat insulin promoter-driven Cre recombinase. Several in vitro and in vivo parameters were measured, including respiration rate, mitochondrial membrane potential, islet ATP content, reactive oxygen species (ROS) levels, glucose-stimulated insulin secretion (GSIS), glucagon secretion, glucose and insulin tolerance, and plasma hormone levels.

Results: UCP2BKO β-cells displayed mildly increased glucose-induced mitochondrial membrane hyperpolarization but unchanged rates of uncoupled respiration and islet ATP content. UCP2BKO islets had elevated intracellular ROS levels that associated with enhanced GSIS. Surprisingly, UCP2BKO mice were glucose-intolerant, showing greater α-cell area, higher islet glucagon content, and aberrant ROS-dependent glucagon secretion under high glucose conditions.

Conclusions: Using a novel β-cell-specific UCP2KO mouse model, we have shed light on UCP2 function in primary β-cells. UCP2 does not behave as a classical metabolic uncoupler in the β-cell, but has a more prominent role in the regulation of intracellular ROS levels that contribute to GSIS amplification. In addition, β-cell UCP2 contributes to the regulation of intraislet ROS signals that mediate changes in α-cell morphology and glucagon secretion.


Figures

FIG. 1.
FIG. 1.
Effective deletion of Ucp2 specifically from pancreatic β-cells using a Cre-lox recombination strategy. A: Targeting construct for the Ucp2 gene shows the floxed region (flanked by loxP sites) and the Ucp2 allele after Cre recombinase excision. Homozygote loxUCP2 mice that express Cre undergo recombination of the DNA between loxP sites, deleting exons 3 and 4, which contains the start codon. B: Typical PCR results from mouse genotyping for loxUCP2 (floxing) and Cre expression. C: Quantitative PCR results show reduced Ucp2 mRNA expression in isolated UCP2BKO islets compared with RIPCre islets. Ucp2 mRNA expression was calculated as a percentage of β-actin. The error bar shows the SEM. D: Standard PCR of various tissues shows full-length UCP2 transcripts and truncated UCP2 (Δ) where exons 3 and 4 have been removed by Cre recombinase activity. Wt, wild type. E, Two left panels: Dispersed pancreatic islets isolated from RIPCre and UCP2BKO mice immunostained for UCP2 (red) and insulin (green). Two right panels: UCP2BKO dispersed islet cells stained for Cre (red) and insulin (green) show nuclear localization of Cre recombinase. The yellow coloring represents colocalization of red and green fluorescence. n = 5–7. *P < 0.05. (A high-quality digital representation of this figure is available in the online issue.)
FIG. 2.
FIG. 2.
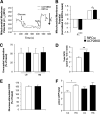
Glucose-induced mitochondrial membrane hyperpolarization is mildly increased in UCP2BKO β-cells, while islet ATP content and uncoupled respiration rates remain unchanged. A: Representative traces of ΔΨm measurements using rhodamine123 in selected large cells (β-cells) from dispersed islets isolated from UCP2BKO and RIPCre mice. ΔΨm was measured initially in the presence of a low (2.8 mmol/L) glucose concentration. Membrane hyperpolarization was induced by the addition of high (20 mmol/L) glucose concentration, and 5 mmol/L sodium azide (NaN3) was used to completely depolarize the mitochondrial membrane to ensure membrane integrity. n = 5 mice/genotype. RFU, relative fluorescence units. B: Measurements of ΔΨm were normalized to basal fluorescence in the presence of low (2.8 mmol/L) glucose concentration and then expressed relative to RIPCre control ΔΨm levels. Δ1, the change in mitochondrial membrane hyperpolarization in response to increased glucose concentration. Δ2, the change in mitochondrial membrane depolarization in response to NaN3 above basal mitochondrial membrane potential. (20–30 cells/coverslip with 3 coverslips per animal were measured.) n = 5 mice/genotype. ***P < 0.001. C: Uncoupled OCR is unchanged in UCP2BKO islets. OCR was measured under saturating concentrations of oligomycin (5 µmol/L) with 3 or 20 mmol/L glucose. Measurements shown are after steady state was achieved. n = 3 separate experiments, with 13–15 measurements per condition. D: Basal OCR is increased in UCP2BKO islets. Measurements are steady state in 3 mmol/L glucose. **P < 0.01. n = 3 separate experiments with 27 (control) and 30 (UCP2BKO) measurements per condition. E: Glucose-stimulated oxygen consumption (expressed as a percentage of the basal OCR) is similar between UCP2BKO and RIPCre islets. Both genotypes experience a 1.5-fold increase in OCR after stimulation with glucose. OCRs were measured in 3 and 20 mmol/L glucose. Measurements were taken after steady state was achieved. n = 4 separate experiments with 18 (control) and 20 (UCP2BKO) measurements per condition. F: Islet ATP content in RIPCre and UCP2BKO islets cultured overnight and incubated in low (2.8 mmol/L) or high (16.7 mmol/L) glucose for 30 min. n = 3 mice/genotype; *P < 0.05. LG, low glucose; HG, high glucose. The error bars show the SEM.
FIG. 3.
FIG. 3.
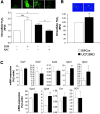
Higher intracellular ROS levels and antioxidant gene expression in UCP2BKO islets. A: Fluorescent microscopy was used to image intracellular H2O2 levels in islets isolated from RIPCre and UCP2BKO mice that were cultured overnight and incubated with the ROS-sensitive fluorescent dye CM-H2-DCFDA, in the presence of 11 mmol/L glucose. Islet intracellular H2O2 levels were manipulated by incubation of RIPCre islets with (+) or without (−) the pro-oxidant DEM (5 mmol/L) or UCP2BKO islets with (+) or without (−) the antioxidant NAC (0.2 mmol/L). Data shown are expressed as the fold-change over RIPCre islets. Representative fluorescent microscopy images of each condition are shown above each bar. n = 11–16 islets from 4 mice/genotype. *P < 0.05, ***P < 0.0001. B: Measurement of intracellular H2O2 in β-cells selected from dispersed islet cells. H2O2 was measured as in A. A total of 20–30 larger cells (i.e. β-cells) were selected for each coverslip. n = 5–7. C: Quantitative PCR was used to quantify the expression of several antioxidant genes as well as the oxidative stress-responsive HO-1 in isolated islets. Data shown are expressed as a percentage of β-actin mRNA expression levels for n = 3–7. *P < 0.05. (A high-quality digital representation of this figure is available in the online issue.)
FIG. 4.
FIG. 4.
UCP2BKO islets display ROS-dependent enhanced GSIS. A: Measurement of GSIS over time in RIPCre and UCP2BKO islets by perifusion with varying concentrations of glucose (2.8, 11, and 16.7 mmol/L). Areas under the curve (AUC) are shown for 11 mmol/L glucose (B) and 16.7 mmol/L glucose (C). n = 6. *P < 0.05. Measurement of GSIS after manipulation of intracellular ROS levels in RIPCre (D) and UCP2BKO (E) islets using the pro-oxidant DEM (5 mmol/L) or the antioxidant NAC (0.2 mmol/L) by static incubation. Islets were preincubated in 2.8 mmol/L glucose for 1 h (±5 mmol/L DEM or 0.2 mmol/L NAC), followed by 30-min incubation in 2.8 or 16.7 mmol/L glucose (±5 mmol/L DEM or 0.2 mmol/L NAC). Insulin secretion was measured in nanograms of insulin per islet. n = 4. *P < 0.05. F: Measurement of GSIS in human islets in the presence or absence of 50 µmol/L genipin. Human islets were subjected to a similar static secretion protocol as mouse islets. Acute preincubation in genipin, a known UCP2 inhibitor, stimulates insulin secretion from human islets. n = 3 independent experiments. **P < 0.01. LG, low glucose; HG, high glucose. The error bars show the SEM.
FIG. 5.
FIG. 5.
UCP2BKO mice are glucose intolerant. A: OGTTs in 12-week-old mice after an overnight fast. The inset shows the incremental area under the glucose curve (iAUC) B: ipITT in 13-week-old mice after a 4-h fast. C: Plasma insulin levels during the OGTT. D: The change in plasma glucagon levels during the first 10 min of the OGTT. Blood samples were taken at 0 and 10 min after glucose gavage, and the change in plasma glucagon level over 10 min was calculated. n = 8–15 mice per genotype. **P < 0.01, ***P < 0.001. The error bars show the SEM.
FIG. 6.
FIG. 6.
Islet morphology. UCPBKO islets have increased α-cell mass. A: Representative images of sectioned and stained mouse pancreata (original magnification ×40). Sections were quantified for islet number per area (mm2). B: Representative images of sectioned and insulin-stained mouse pancreata (original magnification ×400). The insulin-positive area was calculated and normalized to pancreatic slice area. C: Representative images of sectioned and glucagon-stained mouse pancreata (original magnification ×400). The glucagon-positive area was calculated and normalized to pancreatic slice area. n = 4–5 mice/genotype. *P < 0.05. The error bars show the SEM. (A high-quality digital representation of this figure is available in the online issue.)
FIG. 7.
FIG. 7.
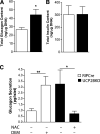
Total glucagon content and glucagon secretion are augmented in UCP2BKO islets. A: Total glucagon content of isolated RIPCre and UCP2BKO islets. Data for n = 6. *P < 0.05. B: Total insulin content of isolated RIPCre and UCP2BKO islets. n = 4–6. C: Glucagon secretion from isolated RIPCre and UCP2BKO islets after incubation in 16.7 mmol/L glucose with (+) or without (−) DEM or NAC, respectively, for 1 h. n = 3–4. *P < 0.05; **P < 0.01. The error bars show the SEM.

Similar articles

Cited by

References

    1. Fleury C, Neverova M, Collins S, et al. . Uncoupling protein-2: a novel gene linked to obesity and hyperinsulinemia. Nat Genet 1997;15:269–272 - PubMed
    1. Echtay KS. Mitochondrial uncoupling proteins—what is their physiological role? Free Radic Biol Med 2007;43:1351–1371 - PubMed
    1. Brand MD, Esteves TC. Physiological functions of the mitochondrial uncoupling proteins UCP2 and UCP3. Cell Metab 2005;2:85–93 - PubMed
    1. Echtay KS, Roussel D, St-Pierre J, et al. . Superoxide activates mitochondrial uncoupling proteins. Nature 2002;415:96–99 - PubMed
    1. Echtay KS, Esteves TC, Pakay JL, et al. . A signalling role for 4-hydroxy-2-nonenal in regulation of mitochondrial uncoupling. EMBO J 2003;22:4103–4110 - PMC - PubMed

Publication types

MeSH terms