A unifying framework underlying mechanotransduction in the somatosensory system - PubMed Skip to main page content
U.S. flag

An official website of the United States government

Dot gov

The .gov means it’s official.
Federal government websites often end in .gov or .mil. Before sharing sensitive information, make sure you’re on a federal government site.

Https

The site is secure.
The https:// ensures that you are connecting to the official website and that any information you provide is encrypted and transmitted securely.

Access keys NCBI Homepage MyNCBI Homepage Main Content Main Navigation
. 2011 Jun 8;31(23):8520-32.
doi: 10.1523/JNEUROSCI.6695-10.2011.

A unifying framework underlying mechanotransduction in the somatosensory system

Affiliations

A unifying framework underlying mechanotransduction in the somatosensory system

Eran Lottem et al. J Neurosci. .

Abstract

Rodents use their whiskers to sense their surroundings. As most of the information available to the somatosensory system originates in whiskers' primary afferents, it is essential to understand the transformation of whisker motion into neuronal activity. Here, we combined in vivo recordings in anesthetized rats with mathematical modeling to ascertain the mechanical and electrical characteristics of mechanotransduction. We found that only two synergistic processes, which reflect the dynamic interactions between (1) receptor and whisker and (2) receptor and surrounding tissue, are needed to describe mechanotransduction during passive whiskers deflection. Interactions between these processes may account for stimulus-dependent changes in the magnitude and temporal pattern of tactile responses on multiple scales. Thus, we are able to explain complex electromechanical processes underlying sensory transduction using a simple model, which captures the responses of a wide range of mechanoreceptor types to diverse sensory stimuli. This compact and precise model allows for a ubiquitous description of how mechanoreceptors encode tactile stimulus.


Figures
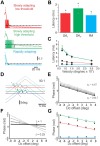
Figure 1.
Figure 1.
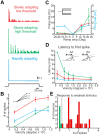
Fitting the model parameters. A, Responses of the three subtypes of model neurons (vertical lines) superimposed on the smoothed average PSTHs for the three neuronal subtypes (colored solid lines) and their corresponding exponential fits (dashed lines). We adjusted the ωr of the model neuron until 10% of the initial firing of the PSTHs was reached (dashed horizontal line). The calibration indicates spikes/bin. The inverse of the decay time constant of the exponential fit for each of the subtypes are as follows: SAlt, −93.9; SAht, −46.4; RA, −128.6. B, Response latency of the neuronal subtypes to step stimuli (SAlt, 1.39 ± 0.06 ms; SAht, 1.73 ± 0.2 ms; RA, 1.22 ± 0.08 ms; *p < 0.01). C, Dependency of latency to first spike on whisker deflection velocity in the three neuronal types. The colored lines and circles indicate the neuronal data, whereas the solid black circles indicate the fit of the model. D, Dependency of firing phase on DC offset in an example SAlt neuron. The horizontal lines show the PSTHs, whereas the diagonal lines show the corresponding stimuli. E, The impact of ωf on the interaction between DC offset and response phase. F, The impact of lf on the interaction between DC offset and response phase. G, The impact of DC offset on response phase in the three neuronal subtypes. The colored lines and circles indicate the neuronal data, whereas the solid black circles indicate the fit of the model.
Figure 2.
Figure 2.
TG neurons are divided into SAlt (red), SAht (green), and RA (blue) types. A, Responses of the three types of neurons to step stimuli. B, Dependence of firing rates on whisker deflection velocity in the three neuronal types (stimuli in inset). C, Direction selectivity as measured by the neurons' responses to preferred and null step whisker deflections (stimuli in inset). D, Dependence of latency to first spike on whisker deflection velocity in the three neuronal types. E, Differentiation between SAlt and SAht according to firing rate at the lowest stimulus velocity (170°/s).
Figure 3.
Figure 3.
Mechanoreceptor model. A, Schematic diagram of the receptor model. Whisker deflection is transduced into mechanical strain which in turn is transformed into current that drives an I&F model. B, Simplified FSC anatomy and its corresponding mechanical element composed of a spring and a damper. C, Triangular whisker deflections at two velocities (757 and 1123°/s at 20 Hz). D, The strain generated by whisker deflection is velocity dependent. E, Normalized current to the I&F neuron. F, Membrane potential responses of the model neuron. G, Model output spike train. The firing rate is dependent on whisker velocity. H, An example PSTH of an SAlt neuron. Note the phase difference in the second response between the model and the neuron. I, Response latency and number of spikes are dependent on whisker velocity in the model neuron.
Figure 4.
Figure 4.
The influence of ωr on amplitude and duration of receptor strain ([sr]+). Plots of [sr]+ for a wide range of velocities and (750–3000°/s) and three different values of ωr are shown.
Figure 5.
Figure 5.
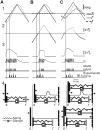
Comparison of the responses of the three models to triangular stimuli. A, Basic model. B, Static rectification model. C, Dynamic rectification model. Triangular whisker stimuli with corresponding receptor (r) and follicle (f) movements (1); [sf], the gray line above the dashed horizontal line indicates positive values (2); and [sr]+, model membrane potential, model output spike train, and an example PSTH of a SAlt neuron (3) are shown. Only the third model captures the phase shift of the response (vertical dotted line). A schematic diagram of the three models is shown (4) (see Mechanical rectification in SA neurons section).
Figure 6.
Figure 6.
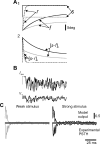
Sustained responses to increasing stimulus amplitude. A1, Time course of r and f in response to increasing step stimuli (gray line, weaker stimulus; black line, stronger stimulus). A2, Time course of the corresponding [sr]+ and [sf]+ in response to step stimuli. B, The level of noise current and membrane potential fluctuations increases as a function of stimulus amplitude (see Materials and Methods). C, Top, The model output PSTHs at two levels of stimulus intensity (gray, black). The corresponding bottom two panels show an example PSTH of a SAlt neuron in response to increasing stimulus intensity (black). The calibration indicates spikes/bin.
Figure 7.
Figure 7.
Predictions of the three models and their relationships with the experimental data. A, Basic model. B, Static rectification model. C, Dynamic rectification model. The top row (1) shows the impact of DC whisker offsets (±7.59°) on response phase (18.9° peak to peak; the three lines show positive, null, and negative offsets of triangular stimuli). The colored circles indicate approximate model firing, the green line is f, and the dashed line indicates response phase as a function of DC offset. D, The impact of DC offset on the discharge probability as a function of stimulus cycle in a SAlt neuron (same as Fig. 1D). The colors in the PSTHs corresponds to the different DC offsets. E, Quantification of the dependence of phase shift on DC offset in all SAlt neurons (solid black line; n = 29). Dashed diagonal and horizontal lines show the expected influences of static rectification and no rectification, respectively, on response phase in model neurons. The second row (2) shows the time course of the response phase in response to triangular stimuli (18.9° peak to peak) superimposed on DC whisker offset (7.59°), the impact of DC offset on the response phase as a function of stimulus cycle in a SAlt neuron (D), and quantification of the dependence of phase shift on cycle number in all SAlt neurons (E). The third row (3) shows the impact of DC whisker offset (−3.8°) on neuronal discharge in response to small triangular stimuli (3.8° peak to peak; red circles indicate model firing; green line is f), the impact of DC offset on the discharge probability as a function of stimulus cycle in a SAlt neuron (D), and quantification of the dependence of response probability on stimulus cycle in all SAlt neurons (E). The bottom row (4) shows a counterintuitive increase in response phase with increased stimulus frequency, which indeed occurred in actual neurons (D) and quantification of the dependence of phase shift on stimulus frequency in all SAlt neurons (E).
Figure 8.
Figure 8.
Changes in the time course of r can account for the initial responses of the different neuronal types to step stimulus and phase precession during periodic stimulus. A, Whisker step stimuli with corresponding receptor and follicle movement (1) and [sr]+ and [sf]+ (2). B, PSTH recorded from the three types of TG neurons (gray) and corresponding model neurons (black) in response to 25 presentations of each stimulus. C, Triangular whisker deflections in the different neuronal subtypes showing the impact of ωr on response phase. Comparison of response phase in the model (1) and comparison of response phase in three corresponding example neurons (2) are shown. D, Response phase in SAlt (n = 29), SAht (n = 6), and RA (n = 12) neurons. E, The impact of ωr on response phase in the model.
Figure 9.
Figure 9.
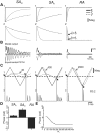
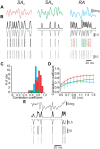
The model neurons accurately predict neuronal responses to complex stimuli. A, Individual whiskers were presented with filtered noise stimuli applied in each neuron's preferred direction. Upward deflections are in the preferred direction, and downward deflections in the null direction. B, PSTHs (top) and rasters (bottom) recorded from the three types of TG neurons (gray) and corresponding model neurons (black) in response to 25 presentations of each stimulus. In the RA model neuron, the green and red dots in the bottom right indicate the responses of the two subunits. C, Histograms of the correlation coefficients between model and actual data in the three types of neurons. D, The impact of response resolution on the correlations between model and actual data. E, PSTHs (top) and rasters (bottom) recorded from an SA neuron (gray) and corresponding model neurons (black) in response to a replay of texture-dependent whisker vibrations.

Similar articles

Cited by

References

    1. Arabzadeh E, Zorzin E, Diamond ME. Neuronal encoding of texture in the whisker sensory pathway. PLoS Biol. 2005;3:155–165. - PMC - PubMed
    1. Arabzadeh E, Panzeri S, Diamond ME. Deciphering the spike train of a sensory neuron: counts and temporal patterns in the rat whisker pathway. J Neurosci. 2006;26:9216–9226. - PMC - PubMed
    1. Bell J, Holmes M. Model of the dynamics of receptor potential in a mechanoreceptor. Math Biosci. 1992;110:139–174. - PubMed
    1. Brecht M, Preilowski B, Merzenich MM. Functional architecture of the mystacial vibrissae. Behav. Brain Res. 1997;84:81–97. - PubMed
    1. Carvell GE, Simons DJ. Biometric analyses of vibrissal tactile discrimination in the rat. J Neurosci. 1990;10:2638–2648. - PMC - PubMed

Publication types