Intravascular Photoacoustic Imaging
- PMID: 21359138
- PMCID: PMC3045110
- DOI: 10.1109/JSTQE.2009.2037023
Intravascular Photoacoustic Imaging
Abstract
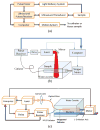
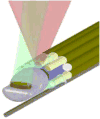
Intravascular photoacoustic (IVPA) imaging is a catheter-based, minimally invasive, imaging modality capable of providing high-resolution optical absorption map of the arterial wall. Integrated with intravascular ultrasound (IVUS) imaging, combined IVPA and IVUS imaging can be used to detect and characterize atherosclerotic plaques building up in the inner lining of an artery. In this paper, we present and discuss various representative applications of combined IVPA/IVUS imaging of atherosclerosis, including assessment of the composition of atherosclerotic plaques, imaging of macrophages within the plaques, and molecular imaging of biomarkers associated with formation and development of plaques. In addition, imaging of coronary artery stents using IVPA and IVUS imaging is demonstrated. Furthermore, the design of an integrated IVUS/IVPA imaging catheter needed for in vivo clinical applications is discussed.
Figures


Similar articles
-
In vivo intravascular ultrasound-guided photoacoustic imaging of lipid in plaques using an animal model of atherosclerosis.Ultrasound Med Biol. 2012 Dec;38(12):2098-103. doi: 10.1016/j.ultrasmedbio.2012.08.006. Epub 2012 Oct 12. Ultrasound Med Biol. 2012. PMID: 23069134 Free PMC article.
-
Intravascular ultrasound and photoacoustic imaging.Annu Int Conf IEEE Eng Med Biol Soc. 2008;2008:2-5. doi: 10.1109/IEMBS.2008.4649075. Annu Int Conf IEEE Eng Med Biol Soc. 2008. PMID: 19162578
-
Development of a catheter for combined intravascular ultrasound and photoacoustic imaging.Rev Sci Instrum. 2010 Jan;81(1):014901. doi: 10.1063/1.3274197. Rev Sci Instrum. 2010. PMID: 20113121 Free PMC article.
-
Intravascular photoacoustic imaging: a new tool for vulnerable plaque identification.Ultrasound Med Biol. 2014 Jun;40(6):1037-48. doi: 10.1016/j.ultrasmedbio.2014.01.008. Epub 2014 Mar 14. Ultrasound Med Biol. 2014. PMID: 24631379 Review.
-
[Intravascular ultrasound for recognition of atherosclerotic plaques and plaque composition. Current state of the diagnostic value].Herz. 2011 Aug;36(5):402-9. doi: 10.1007/s00059-011-3485-9. Herz. 2011. PMID: 21732096 Review. German.
Cited by
-
Application of laser pulse stretching scheme for efficiently delivering laser energy in photoacoustic imaging.J Biomed Opt. 2012 Jun;17(6):061218. doi: 10.1117/1.JBO.17.6.061218. J Biomed Opt. 2012. PMID: 22734748 Free PMC article.
-
Detection of cervical cancer based on photoacoustic imaging-the in-vitro results.Biomed Opt Express. 2014 Dec 15;6(1):135-43. doi: 10.1364/BOE.6.000135. eCollection 2015 Jan 1. Biomed Opt Express. 2014. PMID: 25657882 Free PMC article.
-
Unmixing multi-spectral photoacoustic sources in human carotid plaques using non-negative independent component analysis.Photoacoustics. 2019 Jul 25;15:100140. doi: 10.1016/j.pacs.2019.100140. eCollection 2019 Sep. Photoacoustics. 2019. PMID: 31417847 Free PMC article.
-
UV plasmonic properties of colloidal liquid-metal eutectic gallium-indium alloy nanoparticles.Sci Rep. 2019 Mar 29;9(1):5345. doi: 10.1038/s41598-019-41789-8. Sci Rep. 2019. PMID: 30926856 Free PMC article.
-
Sound Out the Deep Colors: Photoacoustic Molecular Imaging at New Depths.Mol Imaging. 2020 Jan-Dec;19:1536012120981518. doi: 10.1177/1536012120981518. Mol Imaging. 2020. PMID: 33336621 Free PMC article. Review.
References
-
- Rosamond W, Flegal K, Furie K, Go A, Greenlund K, Haase N, Hailpern SM, Ho M, Howard V, Kissela B. Heart disease and stroke statistics–2008 update: A report from the american heart association statistics committee and stroke statistics subcommittee. Circulation. 2008;117:e25–e146. - PubMed
-
- Naghavi M, Libby P, Falk E, Casscells SW, Litovsky S, Rumberger J, Badimon JJ, Stefanadis C, Moreno P, Pasterkamp G, Fayad Z, Stone PH, Waxman S, Raggi P, Madjid M, Zarrabi A, Burke A, Yuan C, Fitzgerald PJ, Siscovick DS, de Korte CL, Aikawa M, Airaksinen KEJ, Assmann G, Becker CR, Chesebro JH, Farb A, Galis ZS, Jackson C, Jang I-K, Koenig W, Lodder RA, March K, Demirovic J, Navab M, Priori SG, Rekhter MD, Bahr R, Grundy SM, Mehran R, Colombo A, Boerwinkle E, Ballantyne C, Insull W, Jr, Schwartz RS, Vogel R, Serruys PW, Hansson GK, Faxon DP, Kaul S, Drexler H, Greenland P, Muller JE, Virmani R, Ridker PM, Zipes DP, Shah PK, Willerson JT. From vulnerable plaque to vulnerable patient: A call for new definitions and risk assessment strategies: Part I. Circulation. 2003;108:1664–1672. - PubMed
-
- Emelianov SY, Aglyamov SR, Shah J, Sethuraman S, Scott WG, Schmitt R, Motamedi M, Karpiouk A, Oraevsky A. Combined ultrasound, optoacoustic and elasticity imaging. Proc 2004 SPIE Photon West Symp, Photons Plus Ultrasound: Imag Sens. 5320:101–112.
-
- Beard PC, Mills TN. Characterization of post mortem arterial tissue using time-resolved photoacoustic spectroscopy at 436, 461 and 532 nm. Phys Med Biol. 1997;42:177–198. - PubMed
-
- Oraevsky AA, Esenaliev RO, Jacques SL, Tittel FK. Laser optoacoustic tomography for medical diagnostics: Principles. Proc 1996 SPIE Photon West Symp, Photons Plus Ultrasound: Imag Sens. 2676:22–31.
Grants and funding
LinkOut - more resources
Full Text Sources
Other Literature Sources
