The GLEaMviz computational tool, a publicly available software to explore realistic epidemic spreading scenarios at the global scale
- PMID: 21288355
- PMCID: PMC3048541
- DOI: 10.1186/1471-2334-11-37
The GLEaMviz computational tool, a publicly available software to explore realistic epidemic spreading scenarios at the global scale
Abstract
Background: Computational models play an increasingly important role in the assessment and control of public health crises, as demonstrated during the 2009 H1N1 influenza pandemic. Much research has been done in recent years in the development of sophisticated data-driven models for realistic computer-based simulations of infectious disease spreading. However, only a few computational tools are presently available for assessing scenarios, predicting epidemic evolutions, and managing health emergencies that can benefit a broad audience of users including policy makers and health institutions.
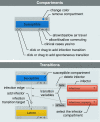
Results: We present "GLEaMviz", a publicly available software system that simulates the spread of emerging human-to-human infectious diseases across the world. The GLEaMviz tool comprises three components: the client application, the proxy middleware, and the simulation engine. The latter two components constitute the GLEaMviz server. The simulation engine leverages on the Global Epidemic and Mobility (GLEaM) framework, a stochastic computational scheme that integrates worldwide high-resolution demographic and mobility data to simulate disease spread on the global scale. The GLEaMviz design aims at maximizing flexibility in defining the disease compartmental model and configuring the simulation scenario; it allows the user to set a variety of parameters including: compartment-specific features, transition values, and environmental effects. The output is a dynamic map and a corresponding set of charts that quantitatively describe the geo-temporal evolution of the disease. The software is designed as a client-server system. The multi-platform client, which can be installed on the user's local machine, is used to set up simulations that will be executed on the server, thus avoiding specific requirements for large computational capabilities on the user side.
Conclusions: The user-friendly graphical interface of the GLEaMviz tool, along with its high level of detail and the realism of its embedded modeling approach, opens up the platform to simulate realistic epidemic scenarios. These features make the GLEaMviz computational tool a convenient teaching/training tool as well as a first step toward the development of a computational tool aimed at facilitating the use and exploitation of computational models for the policy making and scenario analysis of infectious disease outbreaks.
Figures


Similar articles
-
Comparing large-scale computational approaches to epidemic modeling: agent-based versus structured metapopulation models.BMC Infect Dis. 2010 Jun 29;10:190. doi: 10.1186/1471-2334-10-190. BMC Infect Dis. 2010. PMID: 20587041 Free PMC article.
-
GRAPHICAL USER INTERFACE WITH APPLICATIONS IN SUSCEPTIBLE-INFECTIOUS-SUSCEPTIBLE MODELS.Rev Med Chir Soc Med Nat Iasi. 2015 Apr-Jun;119(2):610-4. Rev Med Chir Soc Med Nat Iasi. 2015. PMID: 26204675
-
Fogarty International Center collaborative networks in infectious disease modeling: Lessons learnt in research and capacity building.Epidemics. 2019 Mar;26:116-127. doi: 10.1016/j.epidem.2018.10.004. Epub 2018 Oct 23. Epidemics. 2019. PMID: 30446431 Free PMC article. Review.
-
Predictability and epidemic pathways in global outbreaks of infectious diseases: the SARS case study.BMC Med. 2007 Nov 21;5:34. doi: 10.1186/1741-7015-5-34. BMC Med. 2007. PMID: 18031574 Free PMC article.
-
epiDMS: Data Management and Analytics for Decision-Making From Epidemic Spread Simulation Ensembles.J Infect Dis. 2016 Dec 1;214(suppl_4):S427-S432. doi: 10.1093/infdis/jiw305. J Infect Dis. 2016. PMID: 28830107 Free PMC article. Review.
Cited by
-
Power-law distribution in the number of confirmed COVID-19 cases.Chaos. 2020 Sep;30(9):093123. doi: 10.1063/5.0013031. Chaos. 2020. PMID: 33003939 Free PMC article.
-
A Flexible Simulation Architecture for Pandemic Influenza Simulation.AMIA Annu Symp Proc. 2015 Nov 5;2015:533-42. eCollection 2015. AMIA Annu Symp Proc. 2015. PMID: 26958187 Free PMC article.
-
Rich do not rise early: spatio-temporal patterns in the mobility networks of different socio-economic classes.R Soc Open Sci. 2016 Oct 12;3(10):150654. doi: 10.1098/rsos.150654. eCollection 2016 Oct. R Soc Open Sci. 2016. PMID: 27853531 Free PMC article.
-
Simulating real-life scenarios to better understand the spread of diseases under different contexts.Sci Rep. 2024 Feb 1;14(1):2694. doi: 10.1038/s41598-024-52903-w. Sci Rep. 2024. PMID: 38302695 Free PMC article.
-
Persistent spatial patterns of interacting contagions.Phys Rev E. 2019 Feb;99(2-1):022308. doi: 10.1103/PhysRevE.99.022308. Phys Rev E. 2019. PMID: 30934258 Free PMC article.
References
-
- Balcan D, Hu H, Goncalves B, Bajardi P, Poletto C, Ramasco JJ, Paolotti D, Perra N, Tizzoni M, Van den Broeck W, Colizza V, Vespignani A. Seasonal transmission potential and activity peaks of the new influenza A(H1N1): a Monte Carlo likelihood analysis based on human mobility. BMC Medicine. 2009;7:45. doi: 10.1186/1741-7015-7-45. - DOI - PMC - PubMed
-
- Bisset KR, Chen J, Feng X, Kumar VSA, Marathe MV. EpiFast: a fast algorithm for large scale realistic epidemic simulations on distributed memory systems. Proceedings of the 23rd international conference on Supercomputing, 2009, Yorktown Heights, NY, USA; 2009. pp. 430–439.
Publication types
MeSH terms
Grants and funding
LinkOut - more resources
Full Text Sources
Other Literature Sources
Medical

