A continuum of cell states spans pluripotency and lineage commitment in human embryonic stem cells
- PMID: 19890402
- PMCID: PMC2768791
- DOI: 10.1371/journal.pone.0007708
A continuum of cell states spans pluripotency and lineage commitment in human embryonic stem cells
Abstract
Background: Commitment in embryonic stem cells is often depicted as a binary choice between alternate cell states, pluripotency and specification to a particular germ layer or extraembryonic lineage. However, close examination of human ES cell cultures has revealed significant heterogeneity in the stem cell compartment.
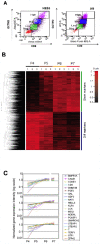
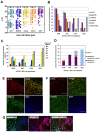
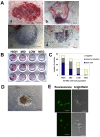
Methodology/principal findings: We isolated subpopulations of embryonic stem cells using surface markers, then examined their expression of pluripotency genes and lineage specific transcription factors at the single cell level, and tested their ability to regenerate colonies of stem cells. Transcript analysis of single embryonic stem cells showed that there is a gradient and a hierarchy of expression of pluripotency genes in the population. Even cells at the top of the hierarchy generally express only a subset of the stem cell genes studied. Many cells co-express pluripotency and lineage specific genes. Cells along the continuum show a progressively decreasing likelihood of self renewal as their expression of stem cell surface markers and pluripotency genes wanes. Most cells that are positive for stem cell surface markers express Oct-4, but only those towards the top of the hierarchy express the nodal receptor TDGF-1 and the growth factor GDF3.
Significance: These findings on gene expression in single embryonic stem cells are in concert with recent studies of early mammalian development, which reveal molecular heterogeneity and a stochasticity of gene expression in blastomeres. Our work indicates that only a small fraction of the population resides at the top of the hierarchy, that lineage priming (co-expression of stem cell and lineage specific genes) characterizes pluripotent stem cell populations, and that extrinsic signaling pathways are upstream of transcription factor networks that control pluripotency.
Conflict of interest statement
Figures


Similar articles
-
Single-cell gene expression profiles define self-renewing, pluripotent, and lineage primed states of human pluripotent stem cells.Stem Cell Reports. 2014 May 22;2(6):881-95. doi: 10.1016/j.stemcr.2014.04.014. eCollection 2014 Jun 3. Stem Cell Reports. 2014. PMID: 24936473 Free PMC article.
-
Single Cell Analysis Reveals Concomitant Transcription of Pluripotent and Lineage Markers During the Early Steps of Differentiation of Embryonic Stem Cells.Stem Cells. 2015 Oct;33(10):2949-60. doi: 10.1002/stem.2108. Stem Cells. 2015. PMID: 26184691
-
Transcriptional analysis of early lineage commitment in human embryonic stem cells.BMC Dev Biol. 2007 Mar 2;7:12. doi: 10.1186/1471-213X-7-12. BMC Dev Biol. 2007. PMID: 17335568 Free PMC article.
-
In or out stemness: comparing growth factor signalling in mouse embryonic stem cells and primordial germ cells.Curr Stem Cell Res Ther. 2009 May;4(2):87-97. doi: 10.2174/157488809788167391. Curr Stem Cell Res Ther. 2009. PMID: 19442193 Review.
-
Mechanisms of pluripotency in vivo and in vitro.Curr Top Dev Biol. 2014;107:1-37. doi: 10.1016/B978-0-12-416022-4.00001-9. Curr Top Dev Biol. 2014. PMID: 24439801 Review.
Cited by
-
Derivation of Naïve Human Embryonic Stem Cells Using a CHK1 Inhibitor.Stem Cell Rev Rep. 2023 Nov;19(8):2980-2990. doi: 10.1007/s12015-023-10613-2. Epub 2023 Sep 13. Stem Cell Rev Rep. 2023. PMID: 37702917 Free PMC article.
-
Early in vitro differentiation of mouse definitive endoderm is not correlated with progressive maturation of nuclear DNA methylation patterns.PLoS One. 2011;6(7):e21861. doi: 10.1371/journal.pone.0021861. Epub 2011 Jul 14. PLoS One. 2011. PMID: 21779341 Free PMC article.
-
p53, Stem Cells, and Reprogramming: Tumor Suppression beyond Guarding the Genome.Genes Cancer. 2011 Apr;2(4):404-19. doi: 10.1177/1947601911410224. Genes Cancer. 2011. PMID: 21779509 Free PMC article.
-
Xenopatients 2.0: reprogramming the epigenetic landscapes of patient-derived cancer genomes.Cell Cycle. 2014;13(3):358-70. doi: 10.4161/cc.27770. Epub 2014 Jan 9. Cell Cycle. 2014. PMID: 24406535 Free PMC article.
-
Gene expression variability as a unifying element of the pluripotency network.Stem Cell Reports. 2014 Aug 12;3(2):365-77. doi: 10.1016/j.stemcr.2014.06.008. Epub 2014 Jul 25. Stem Cell Reports. 2014. PMID: 25254348 Free PMC article.
References
-
- Murry CE, Keller G. Differentiation of embryonic stem cells to clinically relevant populations: lessons from embryonic development. Cell. 2008;132:661–680. - PubMed
-
- Bernstein BE, Mikkelsen TS, Xie X, Kamal M, Huebert DJ, et al. A bivalent chromatin structure marks key developmental genes in embryonic stem cells. Cell. 2006;125:315–326. - PubMed
-
- Enver T, Pera M, Peterson C, Andrews PW. Stem cell states, fates, and the rules of attraction. Cell Stem Cell. 2009;4:387–397. - PubMed
Publication types
MeSH terms
Substances
LinkOut - more resources
Full Text Sources
Other Literature Sources
Molecular Biology Databases

