A global assessment of endemism and species richness across island and mainland regions
- PMID: 19470638
- PMCID: PMC2685248
- DOI: 10.1073/pnas.0810306106
A global assessment of endemism and species richness across island and mainland regions
Abstract
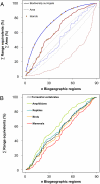
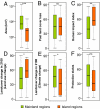
Endemism and species richness are highly relevant to the global prioritization of conservation efforts in which oceanic islands have remained relatively neglected. When compared to mainland areas, oceanic islands in general are known for their high percentage of endemic species but only moderate levels of species richness, prompting the question of their relative conservation value. Here we quantify geographic patterns of endemism-scaled richness ("endemism richness") of vascular plants across 90 terrestrial biogeographic regions, including islands, worldwide and evaluate their congruence with terrestrial vertebrates. Endemism richness of plants and vertebrates is strongly related, and values on islands exceed those of mainland regions by a factor of 9.5 and 8.1 for plants and vertebrates, respectively. Comparisons of different measures of past and future human impact and land cover change further reveal marked differences between mainland and island regions. While island and mainland regions suffered equally from past habitat loss, we find the human impact index, a measure of current threat, to be significantly higher on islands. Projected land-cover changes for the year 2100 indicate that land-use-driven changes on islands might strongly increase in the future. Given their conservation risks, smaller land areas, and high levels of endemism richness, islands may offer particularly high returns for species conservation efforts and therefore warrant a high priority in global biodiversity conservation in this century.
Conflict of interest statement
The authors declare no conflict of interest.
Figures


Similar articles
-
Determinants of bird species richness, endemism, and island network roles in Wallacea and the West Indies: is geography sufficient or does current and historical climate matter?Ecol Evol. 2014 Oct;4(20):4019-31. doi: 10.1002/ece3.1276. Epub 2014 Oct 2. Ecol Evol. 2014. PMID: 25505528 Free PMC article.
-
Plant and animal endemism in the eastern Andean slope: challenges to conservation.BMC Ecol. 2012 Jan 27;12:1. doi: 10.1186/1472-6785-12-1. BMC Ecol. 2012. PMID: 22284854 Free PMC article.
-
Predicting biodiversity change and averting collapse in agricultural landscapes.Nature. 2014 May 8;509(7499):213-7. doi: 10.1038/nature13139. Epub 2014 Apr 16. Nature. 2014. PMID: 24739971
-
Global change impacts on large-scale biogeographic patterns of marine organisms on Atlantic oceanic islands.Mar Pollut Bull. 2018 Jan;126:101-112. doi: 10.1016/j.marpolbul.2017.10.087. Epub 2017 Nov 7. Mar Pollut Bull. 2018. PMID: 29421076 Review.
-
A roadmap to plant functional island biogeography.Biol Rev Camb Philos Soc. 2021 Dec;96(6):2851-2870. doi: 10.1111/brv.12782. Epub 2021 Aug 23. Biol Rev Camb Philos Soc. 2021. PMID: 34423523 Review.
Cited by
-
Building an eDNA surveillance toolkit for invasive rodents on islands: can we detect wild-type and gene drive Mus musculus?BMC Biol. 2024 Nov 15;22(1):261. doi: 10.1186/s12915-024-02063-0. BMC Biol. 2024. PMID: 39548497 Free PMC article.
-
On the Conservation of the Canarian Laurel Forest: What Do Lichens Have to Say?J Fungi (Basel). 2024 Sep 25;10(10):668. doi: 10.3390/jof10100668. J Fungi (Basel). 2024. PMID: 39452620 Free PMC article.
-
Skull evolution and lineage diversification in endemic Malagasy carnivorans.R Soc Open Sci. 2024 Oct 23;11(10):240538. doi: 10.1098/rsos.240538. eCollection 2024 Oct. R Soc Open Sci. 2024. PMID: 39445090 Free PMC article.
-
Islands are key for protecting the world's plant endemism.Nature. 2024 Oct;634(8035):868-874. doi: 10.1038/s41586-024-08036-1. Epub 2024 Oct 16. Nature. 2024. PMID: 39415003
-
Endemic, cosmopolitan, and generalist taxa and their habitat affinities within a coastal marine microbiome.Sci Rep. 2024 Sep 28;14(1):22408. doi: 10.1038/s41598-024-69991-3. Sci Rep. 2024. PMID: 39333653 Free PMC article.
References
-
- Myers N, Mittermeier RA, Mittermeier CG, da Fonseca GAB, Kent J. Biodiversity hotspots for conservation priorities. Nature. 2000;403:853–858. - PubMed
-
- Margules CR, Pressey RL. Systematic conservation planning. Nature. 2000;405:243–253. - PubMed
-
- Olson DM, Dinerstein E. The Global 200: Priority ecoregions for global conservation. Ann Mo Bot Gard. 2002;89:199–224.
-
- Brooks TM, et al. Global biodiversity conservation priorities. Science. 2006;313(5783):58–61. - PubMed
-
- Mittermeier RA, et al. New Mexico: CEMEX; 2004. Hotspots Revisited. Earth's Biologically Richest and Most Endangered Terrestrial Ecoregions.
Publication types
MeSH terms
LinkOut - more resources
Full Text Sources
Other Literature Sources
Miscellaneous

