Embodied information processing: vibrissa mechanics and texture features shape micromotions in actively sensing rats - PubMed Skip to main page content
U.S. flag

An official website of the United States government

Dot gov

The .gov means it’s official.
Federal government websites often end in .gov or .mil. Before sharing sensitive information, make sure you’re on a federal government site.

Https

The site is secure.
The https:// ensures that you are connecting to the official website and that any information you provide is encrypted and transmitted securely.

Access keys NCBI Homepage MyNCBI Homepage Main Content Main Navigation
Comparative Study
. 2008 Feb 28;57(4):599-613.
doi: 10.1016/j.neuron.2007.12.024.

Embodied information processing: vibrissa mechanics and texture features shape micromotions in actively sensing rats

Affiliations
Comparative Study

Embodied information processing: vibrissa mechanics and texture features shape micromotions in actively sensing rats

Jason T Ritt et al. Neuron. .

Abstract

Peripheral sensory organs provide the first transformation of sensory information, and understanding how their physical embodiment shapes transduction is central to understanding perception. We report the characterization of surface transduction during active sensing in the rodent vibrissa sensory system, a widely used model. Employing high-speed videography, we tracked vibrissae while rats sampled rough and smooth textures. Variation in vibrissa length predicted motion mean frequencies, including for the highest velocity events, indicating that biomechanics, such as vibrissa resonance, shape signals most likely to drive neural activity. Rough surface contact generated large amplitude, high-velocity "stick-slip-ring" events, while smooth surfaces generated smaller and more regular stick-slip oscillations. Both surfaces produced velocities exceeding those applied in reduced preparations, indicating active sensation of surfaces generates more robust drive than previously predicted. These findings demonstrate a key role for embodiment in vibrissal sensing and the importance of input transformations in sensory representation.


Figures

Figure 1
Figure 1. Ex vivo Vibrissa Micro-Motions
A. (left) A torque motor was used to sweep vibrissae at realistic ‘whisk’ speeds across sensory surfaces. (right) Still frame of a vibrissa contacting sandpaper. Angular position was measured by the intersection of vibrissae with the red circle. B. The average of 6 vibrissa micro-motion traces shown for three sweep speeds over a periodic grating. Movement of the vibrissae at an intermediate sweep speed, 630°/sec, recruited larger amplitude oscillations than movement at slower or higher sweep speeds. This selective amplification indicates vibrissa resonance tuning, and highlights the impact that variations in sweep speed can have on the form of micro-motions generated by surface contact. C. Schematic of predicted dependence between intrinsic elastic properties of the vibrissa (fundamental resonance frequency, horizontal line) and the sweep speed of vibrissa motion (x axis) across frequency (y axis). Sweeping the vibrissa across a texture with given spatial frequencies will induce temporal responses (diagonal lines), with amplification (filled disk) at an appropriate sweep speed. D. Micro-motions from a vibrissa swept at two different velocities over sandpaper, with a fixed distance of 24.5mm from the base (vibrissa length 32mm). Each panel shows 8 repeated measurements of the same sweep conditions. The time bases are scaled in the ratio 540/720, to align micro-motions generated by the same surface features. Vibrissae generated micro-motion patterns with high consistency across sweeps, but micro-motion patterns changed substantially with a change in sweep speed.
Figure 2
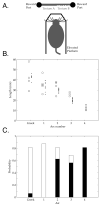
Figure 2. Stereotypy of vibrissa structure and sampling behaviors during the task
A. Schematic of behavior apparatus B. Vibrissa lengths by arc in A to D rows, estimated from high speed videos (N=4) from one session with Rat 4B (dots, one for each video and vibrissa), and comparison to ex vivo lengths from Table 2 of [13] (circles), showing consistent gradient of length with arc position. C. Probabilities that a vibrissa in a given arc did (black) or did not (white) make contact with the surface during the same trials. Total probability is below one due to vibrissae whose contact category could not be conclusively determined from the video. At least one vibrissa in each of the 2, 3 and 4 arcs made contact in every trial (not shown).
Figure 3
Figure 3. Vibrissa Micro-Motions During Active Sensing of a Rough Surface
A. Single frame from high speed video while a rat swept its vibrissae laterally across the surface. The red lines show the tracked positions of an anterior vibrissa every 3rd frame (~1 msec period) prior to the underlying frame. Regions where tracks are more densely spaced indicate slower motion (sticking). The small white vertical bar demarcates the border between the rough and smooth surfaces, which were removed by intensity normalization. This example is taken from a Supplemental Movie S2. B. Three examples of vibrissae tracked during simultaneous contact with the rough surface from the same trial as Figure 3A. The panel on the left shows every 3rd vibrissa track in a region of surface interaction (zero distance is the top left corner of the frame). On the right, the red timeseries is the face-centered angle of motion 5 mm from the face, and the blue line is the simultaneous vibrissa motion through a ‘line scan’ placed ~1 mm from the surface (see Methods; horizontal blue line at left). Time zero is arbitrarily chosen just before any vibrissa made surface contact. Black lines on the tracks on the left indicate the vertical divisions in the timeseries on the right (leftmost black mark indicates the onset of the timeseries). The top two vibrissae were from the left side of the face, the bottom vibrissa from the right. As was typical of rough surface interactions, all three vibrissae demonstrated stick-slip behavior, where the vibrissa decelerated for a sustained period, built tension, and then moved rapidly forward in a ballistic manner, until again decelerating. In many cases, this sudden deceleration following a slip was followed by ringing of the vibrissa, a period of high frequency oscillations (for example, three cycles within 185 to 195 msec in B (top); note the ringing is more pronounced at 5 mm (red) than near the contact point (blue)).
Figure 4
Figure 4. Vibrissa Frequency Gradient During Rough Surface Contact
A. Micro-motion timeseries are shown for two vibrissae during simultaneous contact with a rough surface (green and magenta lines, axis on right). Grayscale shows the instantaneous power (log scale) measured across frequency and time by a Hilbert transform (axis on left: see Methods). Distinct differences in frequency can be observed for the two vibrissae, reflecting the frequency difference evident in the motion trace. Note differences in time scale (x axis). B. The distribution of micro-motion frequencies for 5 vibrissae that contacted a rough surface during the same trial. The distribution from the line scan in the left hand panel of 4A is shown in green, and that from the right hand shown in magenta; annotation provide the lengths of these vibrissa. C. The mean frequency (symbols) and standard deviations (grey bars) for all scanned vibrissae (N = 19) during rough surface contact is plotted against 1/Length2. Red and blue color indicate data from two rats, common symbols indicate samples from distinct vibrissae on the same trial. As described in the text, a significant linear relationship was observed between length and frequency (black line), as predicted by the mechanical properties of the vibrissae. Note that this relation held not only for the population measured across multiple trials, but also for simultaneous contact of multiple vibrissae within each trial.
Figure 5
Figure 5. Vibrissa Contact with a Smooth Surface
A. Average intensity across all frames in a movie of an ex vivo vibrissa sweeping across glass (see Methods and Figure 1). Lighter regions of the image indicate positions of lower vibrissa velocity. An oscillatory pattern can be seen even though the vibrissa is not being obstructed by macroscopic features, suggesting the importance of frictional interactions. B. A track from an in vivo vibrissa during active surface contact with the smooth surface, every frame is shown (~0.3 msec period). Line-marking conventions as in Figure 3. C. Two tracks and line scans from vibrissae simultaneously contacting a smooth surface within a trial. These data correspond to Supplemental Movie S3. The data show that while robust oscillatory behavior was observed in one of the vibrissae during smooth surface contact, no detectable signal was present on a neighboring vibrissa, indicating the diversity of surface interactions. D. The mean frequency and standard deviations for all scanned vibrissae that showed significant micro-motions (N = 15) during smooth surface contact is plotted against 1/Length2. See Figure 4 for legend descriptions.
Figure 6
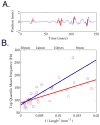
Figure 6. Frequency Gradient with Length for Highest Velocity Micro-Motions
A. Example vibrissa micro-motion trace (blue), with time points in the highest 10% of velocity overlaid (thick red). B. Mean Hilbert frequency for high velocity time points plotted against 1/Length2, showing the same linear relationship as in Figures 4 and 5. Symbol type indicates rough (red square) or smooth (blue circle) contact; lines are corresponding linear regressions (see text).
Figure 7
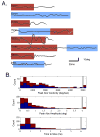
Figure 7. Examples of Micro-Motion Patterns and Marginal Distributions of Event Parameters During Contact with Rough and Smooth Surfaces
A. Example timeseries (gray) of angular position measured 5mm from the base in head centered coordinates. Traces are ordered from long to short vibrissa (top to bottom), with lengths indicated by the legends. The 2nd order fits used to define event parameters are overlaid (black). Times of rough (red) and smooth (blue) surface contact are indicated by shaded backgrounds. B. Histograms of three micro-motion parameters: peak velocity, amplitude and rise time. Red indicates events occurring during rough surface contact, and blue indicates smooth surface contact, stacked together. All observations in the bin to the right of the gray bars are totals for events greater than that value (e.g., greater than 5000°/sec velocity in the top plot).
Figure 8
Figure 8. Joint Distribution of Micro-Motion ‘Events’ During Contact with Rough and Smooth Surfaces
A. Scatterplot showing the joint peak velocity and rise time distribution of all events. Color and shape indicates rough (red squares) and smooth (blue circles) contact events. Size of shape indicates the amplitude of the event, as shown in the figure legend. Dashed lines demarcate the means across all events, and solid lines demarcate the medians. A distinct class of high amplitude events occurs for rough contact. B. Same scatterplot data (grey) with overlaid patches representing stimulus parameters from previous studies that conducted parametric analyses of neuronal responses (blue [, –33], green [7], black curve with triangles [35, 36]). The red curve demarcates events of 3° amplitude, separating high velocity and low velocity psychophysical “channels” found in head posted rats [39]. See text and Methods for details.

Comment in

Similar articles

Cited by

References

    1. von Bekesy G. Experiments in hearing. Vol. 745. New York: McGraw Hill; 1960.
    1. Geisler C. From sound to synapse. New York: Oxford University Press; 1998.
    1. Woolsey TA, Van der Loos H. The structural organization of layer IV in the somatosensory region (SI) of mouse cerebral cortex. The description of a cortical field composed of discrete cytoarchitectonic units. Brain Res. 1970;17(2):205–42. - PubMed
    1. Jacobs GH, Fenwick JA, Williams GA. Cone-based vision of rats for ultraviolet and visible lights. J Exp Biol. 2001;204(Pt 14):2439–46. - PubMed
    1. Pinto DJ, Brumberg JC, Simons DJ. Circuit dynamics and coding strategies in rodent somatosensory cortex. J Neurophysiol. 2000;83(3):1158–66. - PubMed

Publication types

LinkOut - more resources