Deriving structure from evolution: metazoan segmentation
- PMID: 18091725
- PMCID: PMC2174625
- DOI: 10.1038/msb4100192
Deriving structure from evolution: metazoan segmentation
Abstract
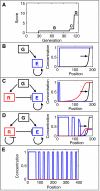
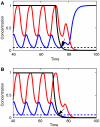
Segmentation is a common feature of disparate clades of metazoans, and its evolution is a central problem of evolutionary developmental biology. We evolved in silico regulatory networks by a mutation/selection process that just rewards the number of segment boundaries. For segmentation controlled by a static gradient, as in long-germ band insects, a cascade of adjacent repressors reminiscent of gap genes evolves. For sequential segmentation controlled by a moving gradient, similar to vertebrate somitogenesis, we invariably observe a very constrained evolutionary path or funnel. The evolved state is a cell autonomous 'clock and wavefront' model, with the new attribute of a separate bistable system driven by an autonomous clock. Early stages in the evolution of both modes of segmentation are functionally similar, and simulations suggest a possible path for their interconversion. Our computation illustrates how complex traits can evolve by the incremental addition of new functions on top of pre-existing traits.
Figures


Similar articles
-
Evolving phenotypic networks in silico.Semin Cell Dev Biol. 2014 Nov;35:90-7. doi: 10.1016/j.semcdb.2014.06.012. Epub 2014 Jun 20. Semin Cell Dev Biol. 2014. PMID: 24956562 Review.
-
Patterning embryos with oscillations: structure, function and dynamics of the vertebrate segmentation clock.Development. 2012 Feb;139(4):625-39. doi: 10.1242/dev.063735. Development. 2012. PMID: 22274695 Review.
-
The ancestry of segmentation.Dev Cell. 2003 Jul;5(1):2-4. doi: 10.1016/s1534-5807(03)00197-7. Dev Cell. 2003. PMID: 12852844
-
Evolution of early development in dipterans: reverse-engineering the gap gene network in the moth midge Clogmia albipunctata (Psychodidae).Biosystems. 2014 Sep;123:74-85. doi: 10.1016/j.biosystems.2014.06.003. Epub 2014 Jun 6. Biosystems. 2014. PMID: 24911671
-
Speeding up anterior-posterior patterning of insects by differential initialization of the gap gene cascade.Dev Biol. 2020 Apr 1;460(1):20-31. doi: 10.1016/j.ydbio.2019.04.015. Epub 2019 May 7. Dev Biol. 2020. PMID: 31075221
Cited by
-
Morphogens in the evolution of size, shape and patterning.Development. 2024 Sep 15;151(18):dev202412. doi: 10.1242/dev.202412. Epub 2024 Sep 18. Development. 2024. PMID: 39302048 Free PMC article. Review.
-
Information content and optimization of self-organized developmental systems.Proc Natl Acad Sci U S A. 2024 Jun 4;121(23):e2322326121. doi: 10.1073/pnas.2322326121. Epub 2024 May 31. Proc Natl Acad Sci U S A. 2024. PMID: 38819997 Free PMC article.
-
The Clock and Wavefront Self-Organizing model recreates the dynamics of mouse somitogenesis in vivo and in vitro.Development. 2024 May 15;151(10):dev202606. doi: 10.1242/dev.202606. Epub 2024 May 16. Development. 2024. PMID: 38742434 Free PMC article.
-
Developmental hourglass: Verification by numerical evolution and elucidation by dynamical-systems theory.PLoS Comput Biol. 2024 Feb 29;20(2):e1011867. doi: 10.1371/journal.pcbi.1011867. eCollection 2024 Feb. PLoS Comput Biol. 2024. PMID: 38422161 Free PMC article.
-
Modelling the evolution of novelty: a review.Essays Biochem. 2022 Dec 8;66(6):727-735. doi: 10.1042/EBC20220069. Essays Biochem. 2022. PMID: 36468669 Free PMC article.
References
-
- Arthur W, Kettle C (2001) Geographic patterning of variation in segment number in geophilomorph centipedes: clines and speciation. Evol Dev 3: 34–40 - PubMed
-
- Aulehla A, Wehrle C, Brand-Saberi B, Kemler R, Gossler A, Kanzler B, Herrmann BG (2003) Wnt3a plays a major role in the segmentation clock controlling somitogenesis. Dev Cell 4: 395–406 - PubMed
-
- Baker RE, Schnell S, Maini PK (2006) A clock and wavefront mechanism for somite formation. Dev Biol 293: 116–126 - PubMed
-
- Clyde DE, Corado MSG, Wu X, Pare A, Papatsenko D, Small S (2003) A self-organizing system of repressor gradients establishes segmental complexity in Drosophila. Nature 426: 849–853 - PubMed
-
- Cooke J, Zeeman EC (1976) A clock and wavefront model for control of the number of repeated structures during animal morphogenesis. J Theor Biol 58: 455–476 - PubMed
Publication types
MeSH terms
Substances
LinkOut - more resources
Full Text Sources
Other Literature Sources
Molecular Biology Databases
Miscellaneous

