wingolog

tracepoints: gnarly but worth it

Hey all, quick post today to mention that I added tracing support to the Whippet GC library. If the support library for LTTng is available when Whippet is compiled, Whippet embedders can visualize the GC process. Like this!

Screenshot of perfetto showing a generational PCC trace

Click above for a full-scale screenshot of the Perfetto trace explorer processing the nboyer microbenchmark with the parallel copying collector on a 2.5x heap. Of course no image will have all the information; the nice thing about trace visualizers like is that you can zoom in to sub-microsecond spans to see exactly what is happening, have nice mouseovers and clicky-clickies. Fun times!

on adding tracepoints

Adding tracepoints to a library is not too hard in the end. You need to pull in the lttng-ust library, which has a pkg-config file. You need to declare your tracepoints in one of your header files. Then you have a minimal C file that includes the header, to generate the code needed to emit tracepoints.

Annoyingly, this header file you write needs to be in one of the -I directories; it can’t be just in the the source directory, because lttng includes it seven times (!!) using computed includes (!!!) and because the LTTng file header that does all the computed including isn’t in your directory, GCC won’t find it. It’s pretty ugly. Ugliest part, I would say. But, grit your teeth, because it’s worth it.

Finally you pepper your source with tracepoints, which probably you wrap in some macro so that you don’t have to require LTTng, and so you can switch to other tracepoint libraries, and so on.

using the thing

I wrote up a little guide for Whippet users about how to actually get traces. It’s not as easy as perf record, which I think is an error. Another ugly point. Buck up, though, you are so close to graphs!

By which I mean, so close to having to write a Python script to make graphs! Because LTTng writes its logs in so-called Common Trace Format, which as you might guess is not very common. I have a colleague who swears by it, that for him it is the lowest-overhead system, and indeed in my case it has no measurable overhead when trace data is not being collected, but his group uses custom scripts to convert the CTF data that he collects to... GTKWave (?!?!?!!).

In my case I wanted to use Perfetto’s UI, so I found a script to convert from CTF to the JSON-based tracing format that Chrome profiling used to use. But, it uses an old version of Babeltrace that wasn’t available on my system, so I had to write a new script (!!?!?!?!!), probably the most Python I have written in the last 20 years.

is it worth it?

Yes. God I love blinkenlights. As long as it’s low-maintenance going forward, I am satisfied with the tradeoffs. Even the fact that I had to write a script to process the logs isn’t so bad, because it let me get nice nested events, which most stock tracing tools don’t allow you to do.

I fixed a small performance bug because of it – a worker thread was spinning waiting for a pool to terminate instead of helping out. A win, and one that never would have shown up on a sampling profiler too. I suspect that as I add more tracepoints, more bugs will be found and fixed.

fin

I think the only thing that would be better is if tracepoints were a part of Linux system ABIs – that there would be header files to emit tracepoint metadata in all binaries, that you wouldn’t have to link to any library, and the actual tracing tools would be intermediated by that ABI in such a way that you wouldn’t depend on those tools at build-time or distribution-time. But until then, I will take what I can get. Happy tracing!

whippet at fosdem

Hey all, the video of my FOSDEM talk on Whippet is up:

Slides here, if that’s your thing.

I ended the talk with some puzzling results around generational collection, which prompted yesterday’s post. I don’t have a firm answer yet. Or rather, perhaps for the splay benchmark, it is to be expected that a generational GC is not great; but there are other benchmarks that also show suboptimal throughput in generational configurations. Surely it is some tuning issue; I’ll be looking into it.

Happy hacking!

baffled by generational garbage collection

Usually in this space I like to share interesting things that I find out; you might call it a research-epistle-publish loop. Today, though, I come not with answers, but with questions, or rather one question, but with fractal surface area: what is the value proposition of generational garbage collection?

hypothesis

The conventional wisdom is encapsulated in a 2004 Blackburn, Cheng, and McKinley paper, “Myths and Realities: The Performance Impact of Garbage Collection”, which compares whole-heap mark-sweep and copying collectors to their generational counterparts, using the Jikes RVM as a test harness. (It also examines a generational reference-counting collector, which is an interesting predecessor to the 2022 LXR work by Zhao, Blackburn, and McKinley.)

The paper finds that generational collectors spend less time than their whole-heap counterparts for a given task. This is mainly due to less time spent collecting, because generational collectors avoid tracing/copying work for older objects that mostly stay in the same place in the live object graph.

The paper also notes an improvement for mutator time under generational GC, but only for the generational mark-sweep collector, which it attributes to the locality and allocation speed benefit of bump-pointer allocation in the nursery. However for copying collectors, generational GC tends to slow down the mutator, probably because of the write barrier, but in the end lower collector times still led to lower total times.

So, I expected generational collectors to always exhibit lower wall-clock times than whole-heap collectors.

test workbench

In whippet, I have a garbage collector with an abstract API that specializes at compile-time to the mutator’s object and root-set representation and to the collector’s allocator, write barrier, and other interfaces. I embed it in whiffle, a simple Scheme-to-C compiler that can run some small multi-threaded benchmarks, for example the classic Gabriel benchmarks. We can then test those benchmarks against different collectors, mutator (thread) counts, and heap sizes. I expect that the generational parallel copying collector takes less time than the whole-heap parallel copying collector.

results?

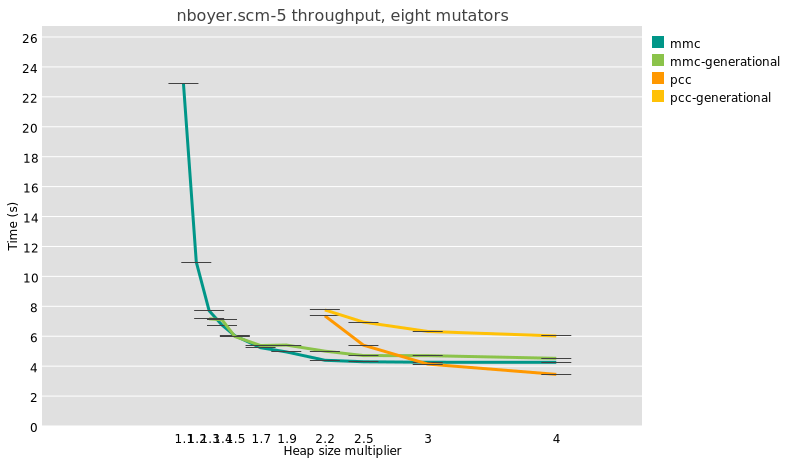
So, I ran some benchmarks. Take the splay-tree benchmark, derived from Octane’s splay.js. I have a port to Scheme, and the results are... not good!

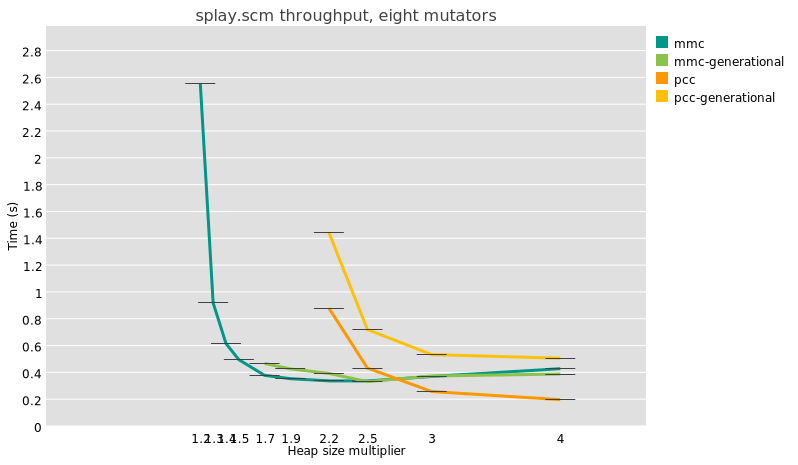
In this graph the “pcc” series is the whole-heap copying collector, and “generational-pcc” is the generational counterpart, with a nursery sized such that after each collection, its size is 2 MB times the number of active mutator threads in the last collector. So, for this test with eight threads, on my 8-core Ryzen 7 7840U laptop, the nursery is 16MB including the copy reserve, which happens to be the same size as the L3 on this CPU. New objects are kept in the nursery one cycle before being promoted to the old generation.

There are also results for “mmc” and “generational-mmc” collectors, which use an Immix-derived algorithm that allows for bump-pointer allocation but which doesn’t require a copy reserve. There, the generational collectors use a sticky mark-bit algorithm, which has very different performance characteristics as promotion is in-place, and the nursery is as large as the available heap size.

The salient point is that at all heap sizes, and for these two very different configurations (mmc and pcc), generational collection takes more time than whole-heap collection. It’s not just the splay benchmark either; I see the same thing for the very different nboyer benchmark. What is the deal?

I am honestly quite perplexed by this state of affairs. I wish I had a narrative to tie this together, but in lieu of that, voici some propositions and observations.

“generational collection is good because bump-pointer allocation”

Sometimes people say that the reason generational collection is good is because you get bump-pointer allocation, which has better locality and allocation speed. This is misattribution: it’s bump-pointer allocators that have these benefits. You can have them in whole-heap copying collectors, or you can have them in whole-heap mark-compact or immix collectors that bump-pointer allocate into the holes. Or, true, you can have them in generational collectors with a copying nursery but a freelist-based mark-sweep allocator. But also you can have generational collectors without bump-pointer allocation, for free-list sticky-mark-bit collectors. To simplify this panorama to “generational collectors have good allocators” is incorrect.

“generational collection lowers pause times”

It’s true, generational GC does lower median pause times:

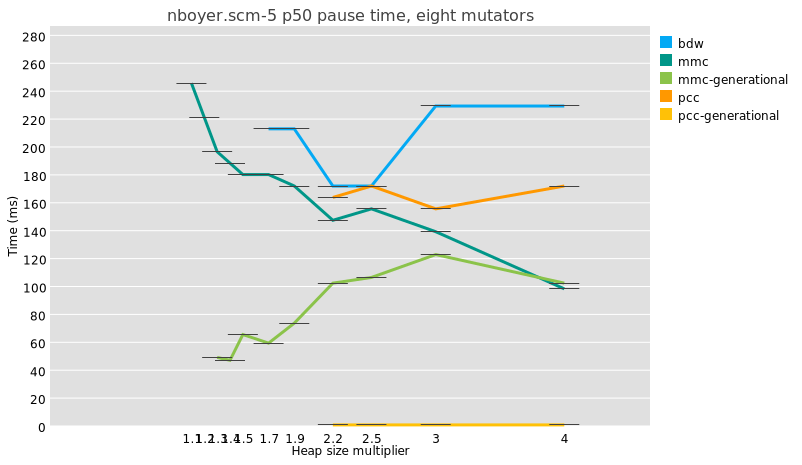
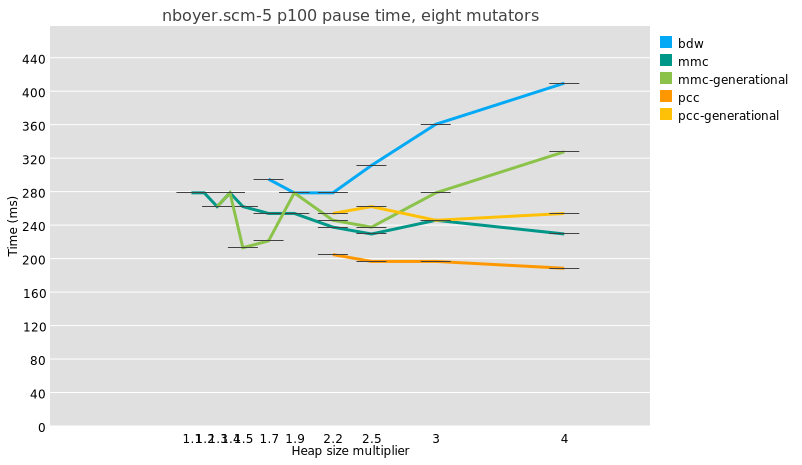
But because a major collection is usually slightly more work under generational GC than in a whole-heap system, because of e.g. the need to reset remembered sets, the maximum pauses are just as big and even a little bigger:

I am not even sure that it is meaningful to compare median pause times between generational and non-generational collectors, given that the former perform possibly orders of magnitude more collections than the latter.

Doing fewer whole-heap traces is good, though, and in the ideal case, the less frequent major traces under generational collectors allows time for concurrent tracing, which is the true mitigation for long pause times.

is it whiffle?

Could it be that the test harness I am using is in some way unrepresentative? I don’t have more than one test harness for Whippet yet. I will start work on a second Whippet embedder within the next few weeks, so perhaps we will have an answer there. Still, there is ample time spent in GC pauses in these benchmarks, so surely as a GC workload Whiffle has some utility.

One reasons that Whiffle might be unrepresentative is that it is an ahead-of-time compiler, whereas nursery addresses are assigned at run-time. Whippet exposes the necessary information to allow a just-in-time compiler to specialize write barriers, for example the inline check that the field being mutated is not in the nursery, and an AOT compiler can’t encode this as an immediate. But it seems a small detail.

Also, Whiffle doesn’t do much compiler-side work to elide write barriers. Could the cost of write barriers be over-represented in Whiffle, relative to a production language run-time?

Relatedly, Whiffle is just a baseline compiler. It does some partial evaluation but no CFG-level optimization, no contification, no nice closure conversion, no specialization, and so on: is it not representative because it is not an optimizing compiler?

is it something about the nursery size?

How big should the nursery be? I have no idea.

As a thought experiment, consider the case of a 1 kilobyte nursery. It is probably too small to allow the time for objects to die young, so the survival rate at each minor collection would be high. Above a certain survival rate, generational GC is probably a lose, because your program violates the weak generational hypothesis: it introduces a needless copy for all survivors, and a synchronization for each minor GC.

On the other hand, a 1 GB nursery is probably not great either. It is plenty large enough to allow objects to die young, but the number of survivor objects in a space that large is such that pause times would not be very low, which is one of the things you would like in generational GC. Also, you lose out on locality: a significant fraction of the objects you traverse are probably out of cache and might even incur TLB misses.

So there is probably a happy medium somewhere. My instinct is that for a copying nursery, you want to make it about as big as L3 cache, which on my 8-core laptop is 16 megabytes. Systems are different sizes though; in Whippet my current heuristic is to reserve 2 MB of nursery per core that was active in the previous cycle, so if only 4 threads are allocating, you would have a 8 MB nursery. Is this good? I don’t know.

is it something about the benchmarks?

I don’t have a very large set of benchmarks that run on Whiffle, and they might not be representative. I mean, they are microbenchmarks.

One question I had was about heap sizes. If a benchmark’s maximum heap size fits in L3, which is the case for some of them, then probably generational GC is a wash, because whole-heap collection stays in cache. When I am looking at benchmarks that evaluate generational GC, I make sure to choose those that exceed L3 size by a good factor, for example the 8-mutator splay benchmark in which minimum heap size peaks at 300 MB, or the 8-mutator nboyer-5 which peaks at 1.6 GB.

But then, should nursery size scale with total heap size? I don’t know!

Incidentally, the way that I scale these benchmarks to multiple mutators is a bit odd: they are serial benchmarks, and I just run some number of threads at a time, and scale the heap size accordingly, assuming that the minimum size when there are 4 threads is four times the minimum size when there is just one thread. However, multithreaded programs are unreliable, in the sense that there is no heap size under which they fail and above which they succeed; I quote:

"Consider 10 threads each of which has a local object graph that is usually 10 MB but briefly 100MB when calculating: usually when GC happens, total live object size is 10×10MB=100MB, but sometimes as much as 1 GB; there is a minimum heap size for which the program sometimes works, but also a minimum heap size at which it always works."

is it the write barrier?

A generational collector partitions objects into old and new sets, and a minor collection starts by visiting all old-to-new edges, called the “remembered set”. As the program runs, mutations to old objects might introduce new old-to-new edges. To maintain the remembered set in a generational collector, the mutator invokes write barriers: little bits of code that run when you mutate a field in an object. This is overhead relative to non-generational configurations, where the mutator doesn’t have to invoke collector code when it sets fields.

So, could it be that Whippet’s write barriers or remembered set are somehow so inefficient that my tests are unrepresentative of the state of the art?

I used to use card-marking barriers, but I started to suspect they cause too much overhead during minor GC and introduced too much cache contention. I switched to precise field-logging barriers some months back for Whippet’s Immix-derived space, and we use the same kind of barrier in the generational copying (pcc) collector. I think this is state of the art. I need to see if I can find a configuration that allows me to measure the overhead of these barriers, independently of other components of a generational collector.

is it something about the generational mechanism?

A few months ago, my only generational collector used the sticky mark-bit algorithm, which is an unconventional configuration: its nursery is not contiguous, non-moving, and can be as large as the heap. This is part of the reason that I implemented generational support for the parallel copying collector, to have a different and more conventional collector to compare against. But generational collection loses on some of these benchmarks in both places!

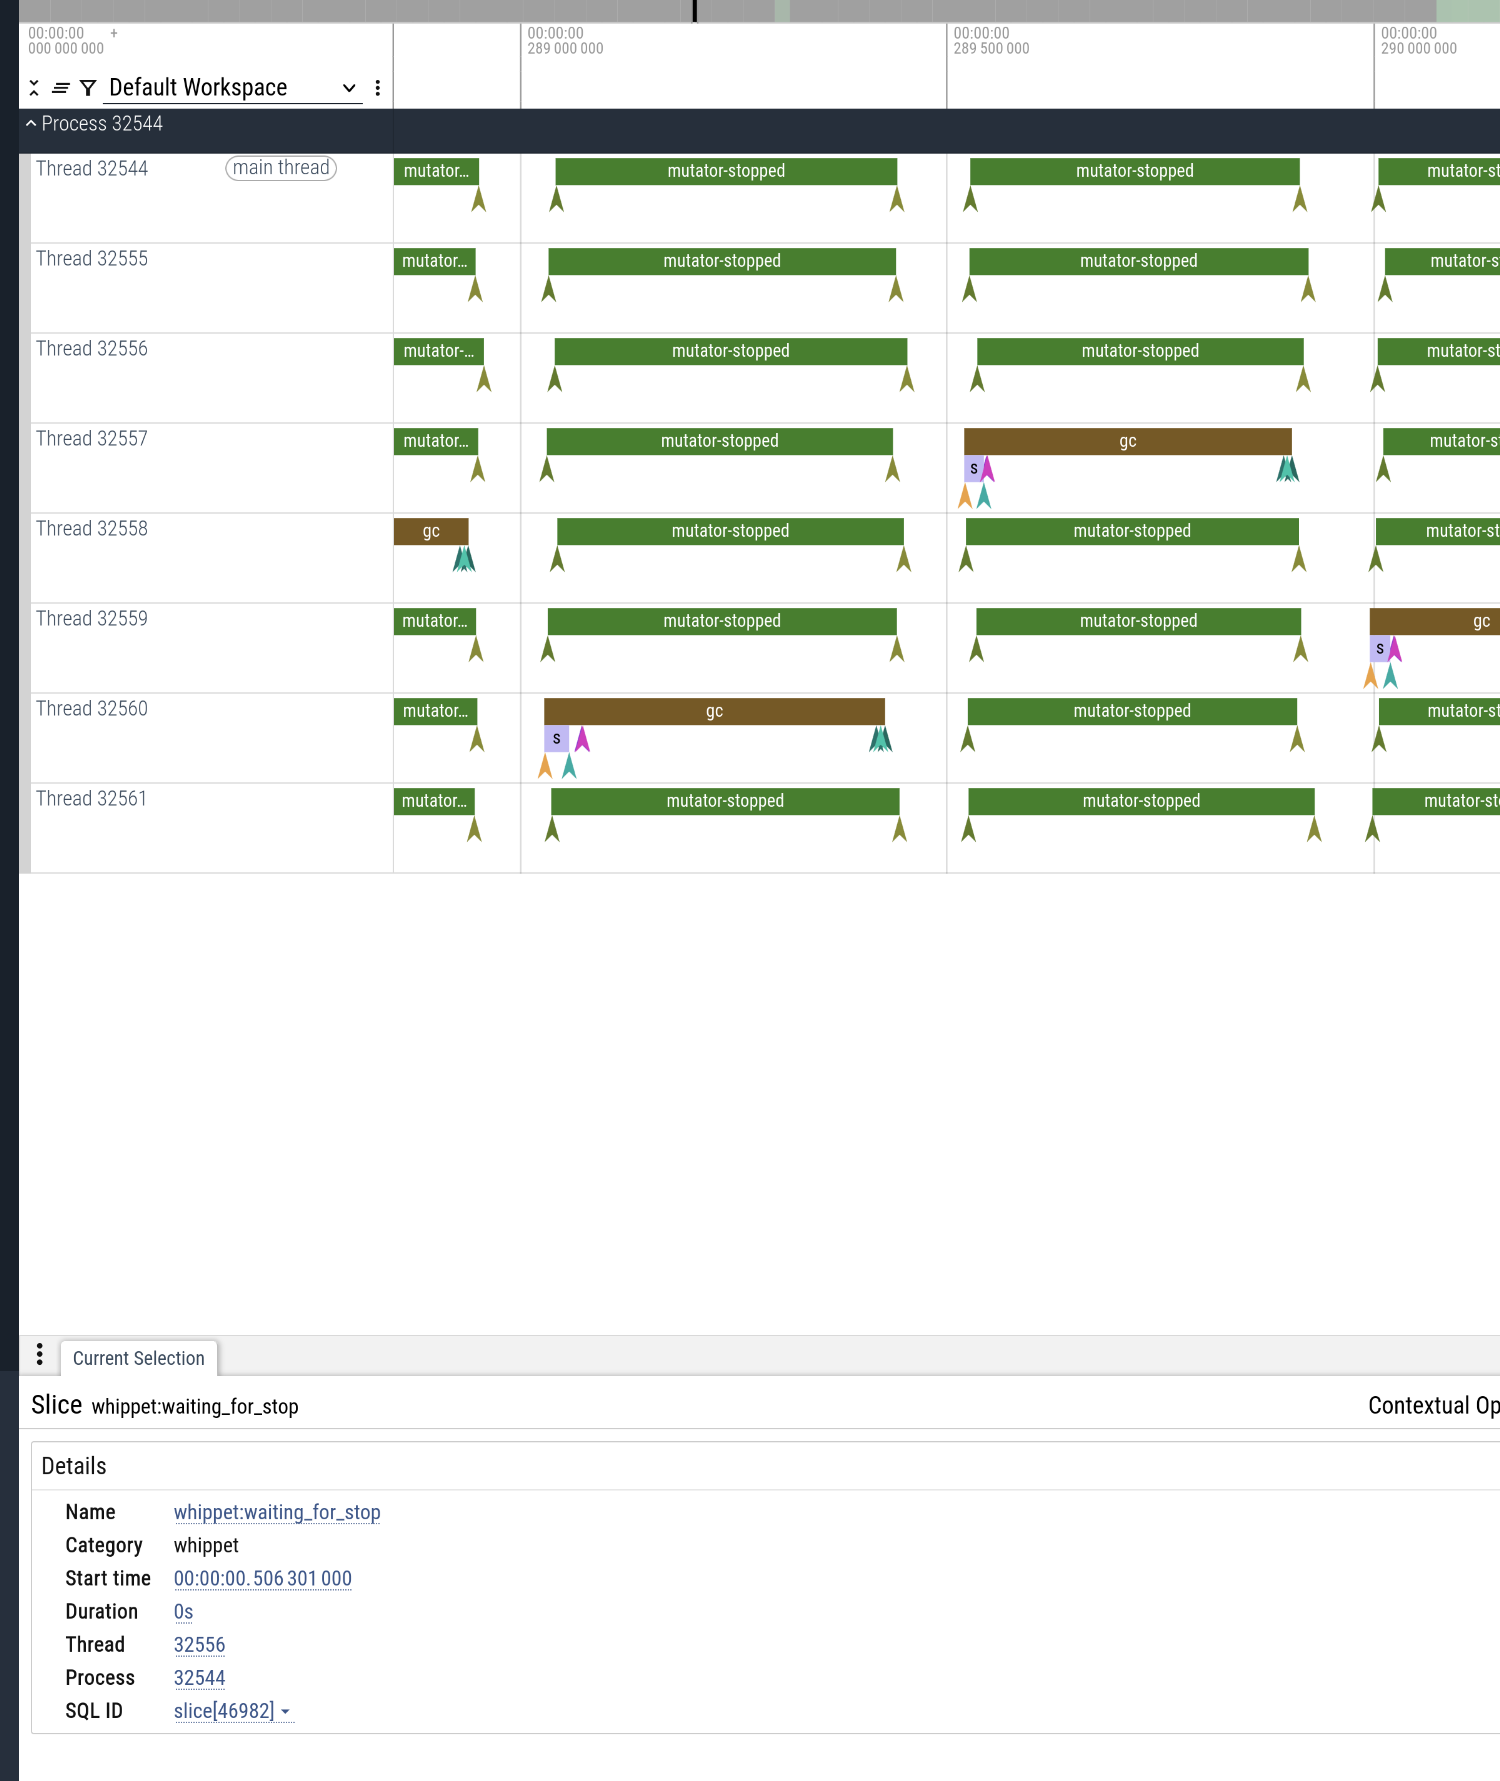
is it something about collecting more often?

On one benchmark which repeatedly constructs some trees and then verifies them, I was seeing terrible results for generational GC, which I realized were because of cooperative safepoints: generational GC collects more often, so it requires that all threads reach safepoints more often, and the non-allocating verification phase wasn’t emitting any safepoints. I had to change the compiler to emit safepoints at regular intervals (in my case, on function entry), and it sped up the generational collector by a significant amount.

This is one instance of a general observation, which is that any work that doesn’t depend on survivor size in a GC pause is more expensive with a generational collector, which runs more collections. Synchronization can be a cost. I had one bug in which tracing ephemerons did work proportional to the size of the whole heap, instead of the nursery; I had to specifically add generational support for the way Whippet deals with ephemerons during a collection to reduce this cost.

is it something about collection frequency?

Looking deeper at the data, I have partial answers for the splay benchmark, and they are annoying :)

Splay doesn’t actually allocate all that much garbage. At a 2.5x heap, the stock parallel MMC collector (in-place, sticky mark bit) collects... one time. That’s all. Same for the generational MMC collector, because the first collection is always major. So at 2.5x we would expect the generational collector to be slightly slower. The benchmark is simply not very good – or perhaps the most generous interpretation is that it represents tasks that allocate 40 MB or so of long-lived data and not much garbage on top.

Also at 2.5x heap, the whole-heap copying collector runs 9 times, and the generational copying collector does 293 minor collections and... 9 major collections. We are not reducing the number of major GCs. It means either the nursery is too small, so objects aren’t dying young when they could, or the benchmark itself doesn’t conform to the weak generational hypothesis.

At a 1.5x heap, the copying collector doesn’t have enough space to run. For MMC, the non-generational variant collects 7 times, and generational MMC times out. Timing out indicates a bug, I think. Annoying!

I tend to think that if I get results and there were fewer than, like, 5 major collections for a whole-heap collector, that indicates that the benchmark is probably inapplicable at that heap size, and I should somehow surface these anomalies in my analysis scripts.

collecting more often redux

Doing a similar exercise for nboyer at 2.5x heap with 8 threads (4GB for 1.6GB live data), I see that pcc did 20 major collections, whereas generational pcc lowered that to 8 major collections and 3471 minor collections. Could it be that there are still too many fixed costs associated with synchronizing for global stop-the-world minor collections? I am going to have to add some fine-grained tracing to find out.

conclusion?

I just don’t know! I want to believe that generational collection was an out-and-out win, but I haven’t yet been able to prove it is true.

I do have some homework to do. I need to find a way to test the overhead of my write barrier – probably using the MMC collector and making it only do major collections. I need to fix generational-mmc for splay and a 1.5x heap. And I need to do some fine-grained performance analysis for minor collections in large heaps.

Enough for today. Feedback / reactions very welcome. Thanks for reading and happy hacking!

here we go again

Good evening, fey readers. Tonight, a note on human rights and human wrongs.

I am in my mid-forties, and so I have seen some garbage governments in my time; one of the worst was Trump’s election in 2016. My heart ached in so many ways, but most of all for immigrants in the US. It has always been expedient for a politician to blame problems on those outside the polity, and in recent years it has been open season on immigration: there is always a pundit ready to make immigrants out to be the source of a society’s ills, always a publisher ready to distribute their views, always a news channel ready to invite the pundit to discuss these Honest Questions, and never will they actually talk to an immigrant. It gives me a visceral sense of revulsion, as much now as in 2016.

What to do? All of what was happening in my country was at a distance. And there is this funny thing that you don’t realize inside the US, in which the weight of the US’s cultural influence is such that the concerns of the US are pushed out into the consciousness of the rest of the world and made out to have a kind of singular, sublime importance, outweighing any concern that people in South Africa or Kosovo or Thailand might be having; and even to the point of outweighing what is happening in your own country of residence. I remember the horror of Europeans upon hearing of Trump’s detention camps—and it is right to be horrified!—but the same people do not know what is happening at and within their own borders, the network of prisons and flophouses and misery created by Europe’s own xenophobic project. The cultural weight of the US is such that it can blind the rest of the world into ignorance of the local, and thus to inaction, there at the place where the rest of us actually have power to act.

I could not help immigrants in the US, practically speaking. So I started to help immigrants in France. I joined the local chapter of the Ligue des droits de l’Homme, an organization with a human rights focus but whose main activity was a weekly legal and administrative advice clinic. I had gone through the immigration pipeline and could help others.

It has been interesting work. One thing that you learn quickly is that not everything that the government does is legal. Sometimes this observation takes the form of an administrative decision that didn’t respect the details of a law. Sometimes it’s something related to the hierarchy of norms, for example that a law’s intent was not reflected in the way it was translated to the operational norms used by, say, asylum processing agents. Sometimes it’s that there was no actual higher norm, but that the norms are made by the people who show up, and if it’s only the cops that show up, things get tilted copwards.

A human-rights approach is essentially liberal, and I don’t know if it is enough in these the end days of a liberal rule of law. It is a tool. But for what I see, it is enough for me right now: there is enough to do, I can make enough meaningful progress for people that the gaping hole in my soul opened by the Trumpocalypse has started to close. I found my balm in this kind of work, but there are as many paths as people, and surely yours will be different.

So, friends, here we are in 2025: new liver, same eagles. These are trying times. Care for yourself and for your loved ones. For some of you, that will be as much as you can do; we all have different situations. But for the rest of us, and especially those who are not really victims of marginalization, we can do things, and it will help people, and what’s more, it will make you feel better. Find some comrades, and reach your capacity gradually; you’re no use if you burn out. I don’t know what is on the other side of this, but in the meantime let’s not make it easy for the bastards.

an annoying failure mode of copying nurseries

I just found a funny failure mode in the Whippet garbage collector and thought readers might be amused.

Say you have a semi-space nursery and a semi-space old generation. Both are block-structured. You are allocating live data, say, a long linked list. Allocation fills the nursery, which triggers a minor GC, which decides to keep everything in the nursery another round, because that’s policy: Whippet gives new objects another cycle in which to potentially become unreachable.

This causes a funny situation!

Consider that the first minor GC doesn’t actually free anything. But, like, nothing: it’s impossible to allocate anything in the nursery after collection, so you run another minor GC, which promotes everything, and you’re back to the initial situation, wash rinse repeat. Copying generational GC is strictly a pessimization in this case, with the additional insult that it doesn’t preserve object allocation order.

Consider also that because copying collectors with block-structured heaps are unreliable, any one of your minor GCs might require more blocks after GC than before. Unlike in the case of a major GC in which this essentially indicates out-of-memory, either because of a mutator bug or because the user didn’t give the program enough heap, for minor GC this is just what we expect when allocating a long linked list.

Therefore we either need to allow a minor GC to allocate fresh blocks – very annoying, and we have to give them back at some point to prevent the nursery from growing over time – or we need to maintain some kind of margin, corresponding to the maximum amount of fragmentation. Or, or, we allow evacuation to fail in a minor GC, in which case we fall back to promotion.

Anyway, I am annoyed and amused and I thought others might share in one or the other of these feelings. Good day and happy hacking!

ephemerons vs generations in whippet

Happy new year, hackfolk! Today, a note about ephemerons. I thought I was done with them, but it seems they are not done with me. The question at hand is, how do we efficiently and correctly implement ephemerons in a generational collector? Whippet‘s answer turns out to be simple but subtle.

on oracles

The deal is, I want to be able to evaluate different collector constructions and configurations, and for that I need a performance oracle: a known point in performance space-time against which to compare the unknowns. For example, I want to know how a sticky mark-bit approach to generational collection does relative to the conventional state of the art. To do that, I need to build a conventional system to compare against! If I manage to do a good job building the conventional evacuating nursery, it will have similar performance characteristics as other nurseries in other unlike systems, and thus I can use it as a point of comparison, even to systems I haven’t personally run myself.

So I am adapting the parallel copying collector I described last July to have generational support: a copying (evacuating) young space and a copying old space. Ideally then I’ll be able to build a collector with a copying young space (nursery) but a mostly-marking nofl old space.

notes on a copying nursery

A copying nursery has different operational characteristics than a sticky-mark-bit nursery, in a few ways. One is that a sticky mark-bit nursery will promote all survivors at each minor collection, leaving the nursery empty when mutators restart. This has the pathology that objects allocated just before a minor GC aren’t given a chance to “die young”: a sticky-mark-bit GC over-promotes.

Contrast that to a copying nursery, which can decide to promote a survivor or leave it in the young generation. In Whippet the current strategy for the parallel-copying nursery I am working on is to keep freshly allocated objects around for another collection, and only promote them if they are live at the next collection. We can do this with a cheap per-block flag, set if the block has any survivors, which is the case if it was allocated into as part of evacuation during minor GC. This gives objects enough time to die young while not imposing much cost in the way of recording per-object ages.

Recall that during a GC, all inbound edges from outside the graph being traced must be part of the root set. For a minor collection where we just trace the nursery, that root set must include all old-to-new edges, which are maintained in a data structure called the remembered set. Whereas for a sticky-mark-bit collector the remembered set will be empty after each minor GC, for a copying collector this may not be the case. An existing old-to-new remembered edge may be unnecessary, because the target object was promoted; we will clear these old-to-old links at some point. (In practice this is done either in bulk during a major GC, or the next time the remembered set is visited during the root-tracing phase of a minor GC.) Or we could have a new-to-new edge which was not in the remembered set before, but now because the source of the edge was promoted, we must adjoin this old-to-new edge to the remembered set.

To preserve the invariant that all edges into the nursery are part of the roots, we have to pay special attention to this latter kind of edge: we could (should?) remove old-to-promoted edges from the remembered set, but we must add promoted-to-survivor edges. The field tracer has to have specific logic that applies to promoted objects during a minor GC to make the necessary remembered set mutations.

other object kinds

In Whippet, “small” objects (less than 8 kilobytes or so) are allocated into block-structed spaces, and large objects have their own space which is managed differently. Notably, large objects are never moved. There is generational support, but it is currently like the sticky-mark-bit approach: any survivor is promoted. Probably we should change this at some point, at least for collectors that don’t eagerly promote all objects during minor collections.

finalizers?

Finalizers keep their target objects alive until the finalizer is run, which effectively makes each finalizer part of the root set. Ideally we would have a separate finalizer table for young and old objects, but currently Whippet just has one table, which we always fully traverse at the end of a collection. This effectively adds the finalizer table to the remembered set. This is too much work—there is no need to visit finalizers for old objects in a minor GC—but it’s not incorrect.

ephemerons

So what about ephemerons? Recall that an ephemeron is an object E×KV in which there is an edge from E to V if and only if both E and K are live. Implementing this conjunction is surprisingly gnarly; you really want to discover live ephemerons while tracing rather than maintaining a global registry as we do with finalizers. Whippet’s algorithm is derived from what SpiderMonkey does, but extended to be parallel.

The question is, how do we implement ephemeron-reachability while also preserving the invariant that all old-to-new edges are part of the remembered set?

For Whippet, the answer turns out to be simple: an ephemeron E is never older than its K or V, by construction, and we never promote E without also promoting (if necessary) K and V. (Ensuring this second property is somewhat delicate.) In this way you never have an old E and a young K or V, so no edge from an ephemeron need ever go into the remembered set. We still need to run the ephemeron tracing algorithm for any ephemerons discovered as part of a minor collection, but we don’t need to fiddle with the remembered set. Phew!

conclusion

As long all promoted objects are older than all survivors, and that all ephemerons are younger than the objects referred to by their key and value edges, Whippet’s parallel ephemeron tracing algorithm will efficiently and correctly trace ephemeron edges in a generational collector. This applies trivially for a sticky-mark-bit collector, which always promotes and has no survivors, but it also holds for a copying nursery that allows for survivors after a minor GC, as long as all survivors are younger than all promoted objects.

Until next time, happy hacking in 2025!

preliminary notes on a nofl field-logging barrier

When you have a generational collector, you aim to trace only the part of the object graph that has been allocated recently. To do so, you need to keep a remembered set: a set of old-to-new edges, used as roots when performing a minor collection. A language run-time maintains this set by adding write barriers: little bits of collector code that run when a mutator writes to a field.

Whippet’s nofl space is a block-structured space that is appropriate for use as an old generation or as part of a sticky-mark-bit generational collector. It used to have a card-marking write barrier; see my article diving into V8’s new write barrier, for more background.

Unfortunately, when running whiffle benchmarks, I was seeing no improvement for generational configurations relative to whole-heap collection. Generational collection was doing fine in my tiny microbenchmarks that are part of Whippet itself, but when translated to larger programs (that aren’t yet proper macrobenchmarks), it was a lose.

I had planned on doing some serious tracing and instrumentation to figure out what was happening, and thereby correct the problem. I still plan on doing this, but instead for this issue I used the old noggin technique instead: just, you know, thinking about the thing, eventually concluding that unconditional card-marking barriers are inappropriate for sticky-mark-bit collectors. As I mentioned in the earlier article:

An unconditional card-marking barrier applies to stores to slots in all objects, not just those in oldspace; a store to a new object will mark a card, but that card may contain old objects which would then be re-scanned. Or consider a store to an old object in a more dense part of oldspace; scanning the card may incur more work than needed. It could also be that Whippet is being too aggressive at re-using blocks for new allocations, where it should be limiting itself to blocks that are very sparsely populated with old objects.

That’s three problems. The second is well-known. But the first and last are specific to sticky-mark-bit collectors, where pages mix old and new objects.

a precise field-logging write barrier

Back in 2019, Steve Blackburn’s paper Design and Analysis of Field-Logging Write Barriers took a look at the state of the art in precise barriers that record not regions of memory that have been updated, but the precise edges (fields) that were written to. He ends up re-using this work later in the 2022 LXR paper (see §3.4), where the write barrier is used for deferred reference counting and a snapshot-at-the-beginning (SATB) barrier for concurrent marking. All in all field-logging seems like an interesting strategy. Relative to card-marking, work during the pause is much less: you have a precise buffer of all fields that were written to, and you just iterate that, instead of iterating objects. Field-logging does impose some mutator cost, but perhaps the payoff is worth it.

To log each old-to-new edge precisely once, you need a bit per field indicating whether the field is logged already. Blackburn’s 2019 write barrier paper used bits in the object header, if the object was small enough, and otherwise bits before the object start. This requires some cooperation between the collector, the compiler, and the run-time that I wasn’t ready to pay for. The 2022 LXR paper was a bit vague on this topic, saying just that it used “a side table”.

In Whippet’s nofl space, we have a side table already, used for a number of purposes:

  1. Mark bits.

  2. Iterability / interior pointers: is there an object at a given address? If so, it will have a recognizable bit pattern.

  3. End of object, to be able to sweep without inspecting the object itself

  4. Pinning, allowing a mutator to prevent an object from being evacuated, for example because a hash code was computed from its address

  5. A hack to allow fully-conservative tracing to identify ephemerons at trace-time; this re-uses the pinning bit, since in practice such configurations never evacuate

  6. Bump-pointer allocation into holes: the mark byte table serves the purpose of Immix’s line mark byte table, but at finer granularity. Because of this though, it is swept lazily rather than eagerly.

  7. Generations. Young objects have a bit set that is cleared when they are promoted.

Well. Why not add another thing? The nofl space’s granule size is two words, so we can use two bits of the byte for field logging bits. If there is a write to a field, a barrier would first check that the object being written to is old, and then check the log bit for the field being written. The old check will be to a byte that is nearby or possibly the same as the one to check the field logging bit. If the bit is unsert, we call out to a slow path to actually record the field.

preliminary results

I disassembled the fast path as compiled by GCC and got something like this on x86-64, in AT&T syntax, for the young-generation test:

mov    %rax,%rdx
and    $0xffffffffffc00000,%rdx
shr    $0x4,%rax
and    $0x3ffff,%eax
or     %rdx,%rax
testb  $0xe,(%rax)

The first five instructions compute the location of the mark byte, from the address of the object (which is known to be in the nofl space). If it has any of the bits in 0xe set, then it’s in the old generation.

Then to test a field logging bit it’s a similar set of instructions. In one of my tests the data type looks like this:

struct Node {
  uintptr_t tag;
  struct Node *left;
  struct Node *right;
  int i, j;
};

Writing the left field will be in the same granule as the object itself, so we can just test the byte we fetched for the logging bit directly with testb against $0x80. For right, we should be able to know it’s in the same slab (aligned 4 MB region) and just add to the previously computed byte address, but the C compiler doesn’t know that right now and so recomputes. This would work better in a JIT. Anyway I think these bit-swizzling operations are just lost in the flow of memory accesses.

For the general case where you don’t statically know the offset of the field in the object, you have to compute which bit in the byte to test:

mov    %r13,%rcx
mov    $0x40,%eax
shr    $0x3,%rcx
and    $0x1,%ecx
shl    %cl,%eax
test   %al,%dil

Is it good? Well, it improves things for my whiffle benchmarks, relative to the card-marking barrier, seeing a 1.05×-1.5× speedup across a range of benchmarks. I suspect the main advantage is in avoiding the “unconditional” part of card marking, where a write to a new object could cause old objects to be added to the remembered set. There are still quite a few whiffle configurations in which the whole-heap collector outperforms the sticky-mark-bit generational collector, though; I hope to understand this a bit more by building a more classic semi-space nursery, and comparing performance to that.

Implementation links: the barrier fast-path, the slow path, and the sequential store buffers. (At some point I need to make it so that allocating edge buffers in the field set causes the nofl space to page out a corresponding amount of memory, so as to be honest when comparing GC performance at a fixed heap size.)

Until next time, onwards and upwards!

needed-bits optimizations in guile

Hey all, I had a fun bug this week and want to share it with you.

numbers and representations

First, though, some background. Guile’s numeric operations are defined over the complex numbers, not over e.g. a finite field of integers. This is generally great when writing an algorithm, because you don’t have to think about how the computer will actually represent the numbers you are working on.

In practice, Guile will represent a small exact integer as a fixnum, which is a machine word with a low-bit tag. If an integer doesn’t fit in a word (minus space for the tag), it is represented as a heap-allocated bignum. But sometimes the compiler can realize that e.g. the operands to a specific bitwise-and operation are within (say) the 64-bit range of unsigned integers, and so therefore we can use unboxed operations instead of the more generic functions that do run-time dispatch on the operand types, and which might perform heap allocation.

Unboxing is important for speed. It’s also tricky: under what circumstances can we do it? In the example above, there is information that flows from defs to uses: the operands of logand are known to be exact integers in a certain range and the operation itself is closed over its domain, so we can unbox.

But there is another case in which we can unbox, in which information flows backwards, from uses to defs: if we see (logand n #xff), we know:

  • the result will be in [0, 255]

  • that n will be an exact integer (or an exception will be thrown)

  • we are only interested in a subset of n‘s bits.

Together, these observations let us transform the more general logand to an unboxed operation, having first truncated n to a u64. And actually, the information can flow from use to def: if we know that n will be an exact integer but don’t know its range, we can transform the potentially heap-allocating computation that produces n to instead truncate its result to the u64 range where it is defined, instead of just truncating at the use; and potentially this information could travel farther up the dominator tree, to inputs of the operation that defines n, their inputs, and so on.

needed-bits: the |0 of scheme

Let’s say we have a numerical operation that produces an exact integer, but we don’t know the range. We could truncate the result to a u64 and use unboxed operations, if and only if only u64 bits are used. So we need to compute, for each variable in a program, what bits are needed from it.

I think this is generally known a needed-bits analysis, though both Google and my textbooks are failing me at the moment; perhaps this is because dynamic languages and flow analysis don’t get so much attention these days. Anyway, the analysis can be local (within a basic block), global (all blocks in a function), or interprocedural (larger than a function). Guile’s is global. Each CPS/SSA variable in the function starts as needing 0 bits. We then compute the fixpoint of visiting each term in the function; if a term causes a variable to flow out of the function, for example via return or call, the variable is recorded as needing all bits, as is also the case if the variable is an operand to some primcall that doesn’t have a specific needed-bits analyser.

Currently, only logand has a needed-bits analyser, and this is because sometimes you want to do modular arithmetic, for example in a hash function. Consider Bon Jenkins’ lookup3 string hash function:

#define rot(x,k) (((x)<<(k)) | ((x)>>(32-(k))))
#define mix(a,b,c) \
{ \
  a -= c;  a ^= rot(c, 4);  c += b; \
  b -= a;  b ^= rot(a, 6);  a += c; \
  c -= b;  c ^= rot(b, 8);  b += a; \
  a -= c;  a ^= rot(c,16);  c += b; \
  b -= a;  b ^= rot(a,19);  a += c; \
  c -= b;  c ^= rot(b, 4);  b += a; \
}
...

If we transcribe this to Scheme, we get something like:

(define (jenkins-lookup3-hashword2 str)
  (define (u32 x) (logand x #xffffFFFF))
  (define (shl x n) (u32 (ash x n)))
  (define (shr x n) (ash x (- n)))
  (define (rot x n) (logior (shl x n) (shr x (- 32 n))))
  (define (add x y) (u32 (+ x y)))
  (define (sub x y) (u32 (- x y)))
  (define (xor x y) (logxor x y))

  (define (mix a b c)
    (let* ((a (sub a c)) (a (xor a (rot c 4)))  (c (add c b))
           (b (sub b a)) (b (xor b (rot a 6)))  (a (add a c))
           (c (sub c b)) (c (xor c (rot b 8)))  (b (add b a))
           ...)
      ...))

  ...

These u32 calls are like the JavaScript |0 idiom, to tell the compiler that we really just want the low 32 bits of the number, as an integer. Guile’s compiler will propagate that information down to uses of the defined values but also back up the dominator tree, resulting in unboxed arithmetic for all of these operations.

(When writing this, I got all the way here and then realized I had already written quite a bit about this, almost a decade ago ago. Oh well, consider this your lucky day, you get two scoops of prose!)

the bug

All that was just prelude. So I said that needed-bits is a fixed-point flow analysis problem. In this case, I want to compute, for each variable, what bits are needed for its definition. Because of loops, we need to keep iterating until we have found the fixed point. We use a worklist to represent the conts we need to visit.

Visiting a cont may cause the program to require more bits from the variables that cont uses. Consider:

(define-significant-bits-handler
    ((logand/immediate label types out res) param a)
  (let ((sigbits (sigbits-intersect
                   (inferred-sigbits types label a)
                   param
                   (sigbits-ref out res))))
    (intmap-add out a sigbits sigbits-union)))

This is the sigbits (needed-bits) handler for logand when one of its operands (param) is a constant and the other (a) is variable. It adds an entry for a to the analysis out, which is an intmap from variable to a bitmask of needed bits, or #f for all bits. If a already has some computed sigbits, we add to that set via sigbits-union. The interesting point comes in the sigbits-intersect call: the bits that we will need from a are first the bits that we infer a to have, by forward type-and-range analysis; intersected with the bits from the immediate param; intersected with the needed bits from the result value res.

If the intmap-add call is idempotent—i.e., out already contains sigbits for a—then out is returned as-is. So we can check for a fixed-point by comparing out with the resulting analysis, via eq?. If they are not equal, we need to add the cont that defines a to the worklist.

The bug? The bug was that we were not enqueuing the def of a, but rather the predecessors of label. This works when there are no cycles, provided we visit the worklist in post-order; and regardless, it works for many other analyses in Guile where we compute, for each labelled cont (basic block), some set of facts about all other labels or about all other variables. In that case, enqueuing a predecessor on the worklist will cause all nodes up and to including the variable’s definition to be visited, because each step adds more information (relative to the analysis computed on the previous visit). But it doesn’t work for this case, because we aren’t computing a per-label analysis.

The solution was to rewrite that particular fixed-point to enqueue labels that define a variable (possibly multiple defs, because of joins and loop back-edges), instead of just the predecessors of the use.

Et voilà ! If you got this far, bravo. Type at y’all again soon!

fedi is for losers

Does the fediverse have a vibe? I think that yes, there’s a flave, and with reason: we have things in common. We all left Twitter, or refused to join in the first place. Many of us are technologists or tech-adjacent, but generally not startuppy. There is a pervasive do-it-yourself ethos. This last point often expresses itself as a reaction: if you don’t like it, then do it yourself, a different way. Make your own Mastoverse agent. Defederate. Switch instances. Fedi is the “patches welcome” of community: just fork it!

Fedi is freedom, in the sense of “feel free to send a patch”, which is also hacker-speak for “go fuck yourself”. We split; that’s our thing! Which, you know, no-platform the nazis and terfs, of course. It can be good and even necessary to cut ties with the bad. And yet, this is not a strategy for winning. What’s worse, it risks creating a feedback loop with losing, which is the topic of this screed.

alembics

Fedi distills losers: AI, covid, class war, climate, free software, on all of these issues, the sort of people that fedi attracts are those that lost. But, good news everyone: in fedi you don’t have to engage with the world, only with fellow losers! I know. I include myself in these sets. But beyond the fact that I don’t want to be a loser, it is imperative that we win: we can’t just give up on climate or class war. Thing is, we don’t have a plan to win, and the vibe I get from fedi is much more disengaged than strategic.

Twitter—and I admit, I loved Twitter, of yore—Twitter is now for the winners: the billionaires, the celebrities, the politicians. These attract the shills, the would-be’s. But winner is just another word for future has-been; nobody will gain power in the world via Twitter any more. Twitter continues to be a formidable force, but it wanes by the day.

Still, when I check my feed, there are some people I follow doing interesting work on Twitter: consider Tobi Haslett, Erin Pineda, Bree Newsome, Cédric Herrou, Louis Allday, Gabriel Winant, Hamilton Nolan, James Butler, Serge Slama: why there and not fedi? Sure, there is inertia: the network was woven on Twitter, not the mastoverse. But I am not sure that fedi is right for them, either. I don’t know that fedi is the kind of loser that is ready to get back in the ring and fight to win.

theories of power

What is fedi’s plan to win? If our model is so good, what are we doing to make it a dominant mode of social discourse, of using it as a vector to effect the changes we want to see in the world?

From where I sit, I don’t see that we have a strategy. Fedi is fine and all, but it doesn’t scare anyone. That’s not good enough. Twitter was always flawed but it was a great tool for activism and continues to be useful in some ways. Bluesky has some of that old-Twitter vibe, and perhaps it will supplant the original, in time; inshallah.

In the meantime, in fedi, I would like to suggest that with regards to the network itself, that we stop patting ourselves on the back. What we have is good but not good enough. We should aim to make the world a better place and neither complacency nor splitting are going to get us there. If fedi is to thrive, we need to get out of our own heads and make our community a place to be afraid of.

whippet progress update: feature-complete!

Greetings, gentle readers. Today, an update on recent progress in the Whippet embeddable garbage collection library.

feature-completeness

When I started working on Whippet, two and a half years ago already, I was aiming to make a new garbage collector for Guile. In the beginning I was just focussing on proving that it would be advantageous to switch, and also learning how to write a GC. I put off features like ephemerons and heap resizing until I was satisfied with the basics.

Well now is the time: with recent development, Whippet is finally feature-complete! Huzzah! Now it’s time to actually work on getting it into Guile. (I have some performance noodling to do before then, adding tracing support, and of course I have lots of ideas for different collectors to build, but I don’t have any missing features at the current time.)

heap resizing

When you benchmark a garbage collector (or a program with garbage collection), you generally want to fix the heap size. GC overhead goes down with more memory, generally speaking, so you don’t want to compare one collector at one size to another collector at another size.

(Unfortunately, many (most?) benchmarks of dynamic language run-times and the programs that run on them fall into this trap. Imagine you are benchmarking a program before and after a change. Automatic heap sizing is on. Before your change the heap size is 200 MB, but after it is 180 MB. The benchmark shows the change to regress performance. But did it really? It could be that at the same heap size, the change improved performance. You won’t know unless you fix the heap size.)

Anyway, Whippet now has an implementation of MemBalancer. After every GC, we measure the live size of the heap, and compute a new GC speed, as a constant factor to live heap size. Every second, in a background thread, we observe the global allocation rate. The heap size is then the live data size plus the square root of the live data size times a factor. The factor has two components. One is constant, the expansiveness of the heap: the higher it is, the more room the program has. The other depends on the program, and is computed as the square root of the ratio of allocation speed to collection speed.

With MemBalancer, the heap ends up getting resized at every GC, and via the heartbeat thread. During the GC it’s easy because it’s within the pause; no mutators are running. From the heartbeat thread, mutators are active: taking the heap lock prevents concurrent resizes, but mutators are still consuming empty blocks and producing full blocks. This works out fine in the same way that concurrent mutators is fine: shrinking takes blocks from the empty list one by one, atomically, and returns them to the OS. Expanding might reclaim paged-out blocks, or allocate new slabs of blocks.

However, even with some exponentially weighted averaging on the speed observations, I have a hard time understanding whether the algorithm is overall a good thing. I like the heartbeat thread, as it can reduce memory use of idle processes. The general square-root idea sounds nice enough. But adjusting the heap size at every GC feels like giving control of your stereo’s volume knob to a hyperactive squirrel.

GC collection time vs memory usage graph comparing V8 with MemBalancer. MemBalancer is shown to be better.
Figure 5 from the MemBalancer paper

Furthermore, the graphs in the MemBalancer paper are not clear to me: the paper claims more optimal memory use even in a single-heap configuration, but the x axis of the graphs is “average heap size”, which I understand to mean that maximum heap size could be higher than V8’s maximum heap size, taking into account more frequent heap size adjustments. Also, some measurement of total time would have been welcome, in addition to the “garbage collection time” on the paper’s y axis; there are cases where less pause time doesn’t necessarily correlate to better total times.

deferred page-out

Motivated by MemBalancer’s jittery squirrel, I implemented a little queue for use in paging blocks in and out, for the mmc and pcc collectors: blocks are quarantined for a second or two before being returned to the OS via madvise(MADV_DONTNEED). That way if you release a page and then need to reacquire it again, you can do so without bothering the kernel or other threads. Does it matter? It seems to improve things marginally and conventional wisdom says to not mess with the page table too much, but who knows.

mmc rename

Relatedly, Whippet used to be three things: the project itself, consisting of an API and a collection of collectors; one specific collector; and one specific space within that collector. Last time I mentioned that I renamed the whippet space to the nofl space. Now I finally got around to renaming what was the whippet collector as well: it is now the mostly-marking collector, or mmc. Be it known!

Also as a service note, I removed the “serial copying collector” (scc). It had the same performance as the parallel copying collector with parallelism=1, and pcc can be compiled with GC_PARALLEL=0 to explicitly choose the simpler serial grey-object worklist.

per-object pinning

The nofl space has always supported pinned objects, but it was never exposed in the API. Now it is!

Of course, collectors with always-copying spaces won’t be able to pin objects. If we want to support use of these collectors with embedders that require pinning, perhaps because of conservative root scanning, we’d need to switch to some kind of mostly-copying algorithm.

safepoints without allocation

Another missing feature was a safepoint API. It hasn’t been needed up to now because my benchmarks all allocate, but for programs that have long (tens of microseconds maybe) active periods without allocation, you want to be able to stop them without waiting too long. Well we have that exposed in the API now.

removed ragged stop

Following on my article on ragged stops, I removed ragged-stop marking from mmc, for a nice net 180 line reduction in some gnarly code. Speed seems to be similar.

next up: tracing

And with that, I’m relieved to move on to the next phase of Whippet development. Thanks again to NLnet for their support of this work. Next up, adding fine-grained tracing, so that I can noodle a bit on performance. Happy allocating!